Visualization of Longitudinal Data
1 Preamble
1.1 Load Libraries
1.2 Load Data
The data for this example were simulated:
Code
mydata_long <- read.csv("./data/mydata_long.csv")2 Pre-Figure Processing
3 Plot Observed Growth Curves
3.1 Observed Growth Curves
Code
ggplot(
  data = mydata_long,
  mapping = aes(
    x = age,
    y = depression,
    group = ID)) +
  geom_line(
    alpha = 0.25
  ) +
  labs(
    x = "Age (Years)",
    y = "Depression Symptoms"
  ) +
  theme_classic()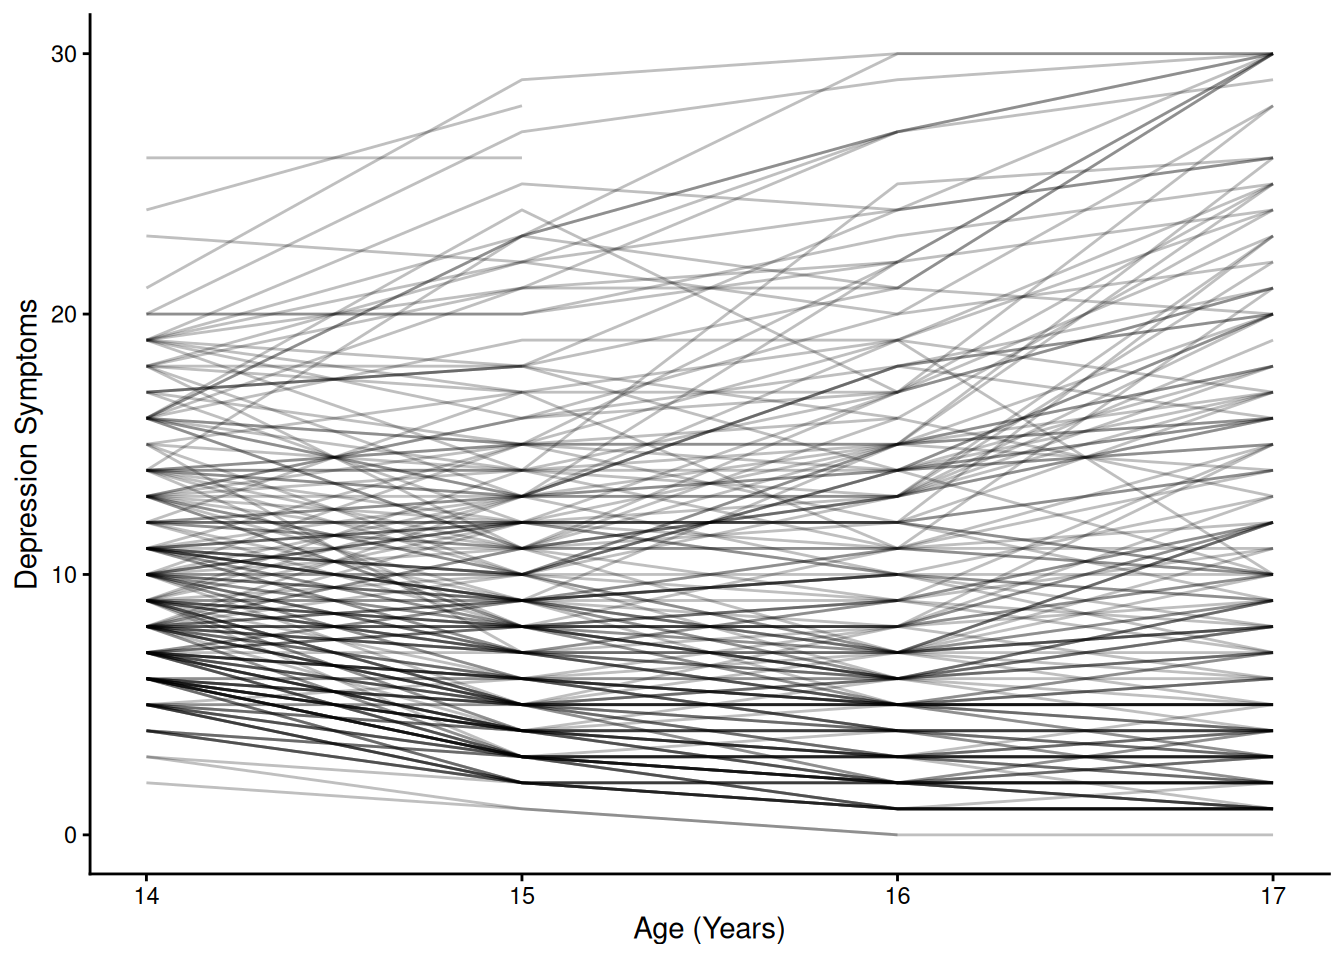
Code
ggplot(
  data = mydata_long,
  mapping = aes(
    x = age,
    y = anxiety,
    group = ID)) +
  geom_line(
    alpha = 0.25
  ) +
  labs(
    x = "Age (Years)",
    y = "Anxiety Symptoms"
  ) +
  theme_classic()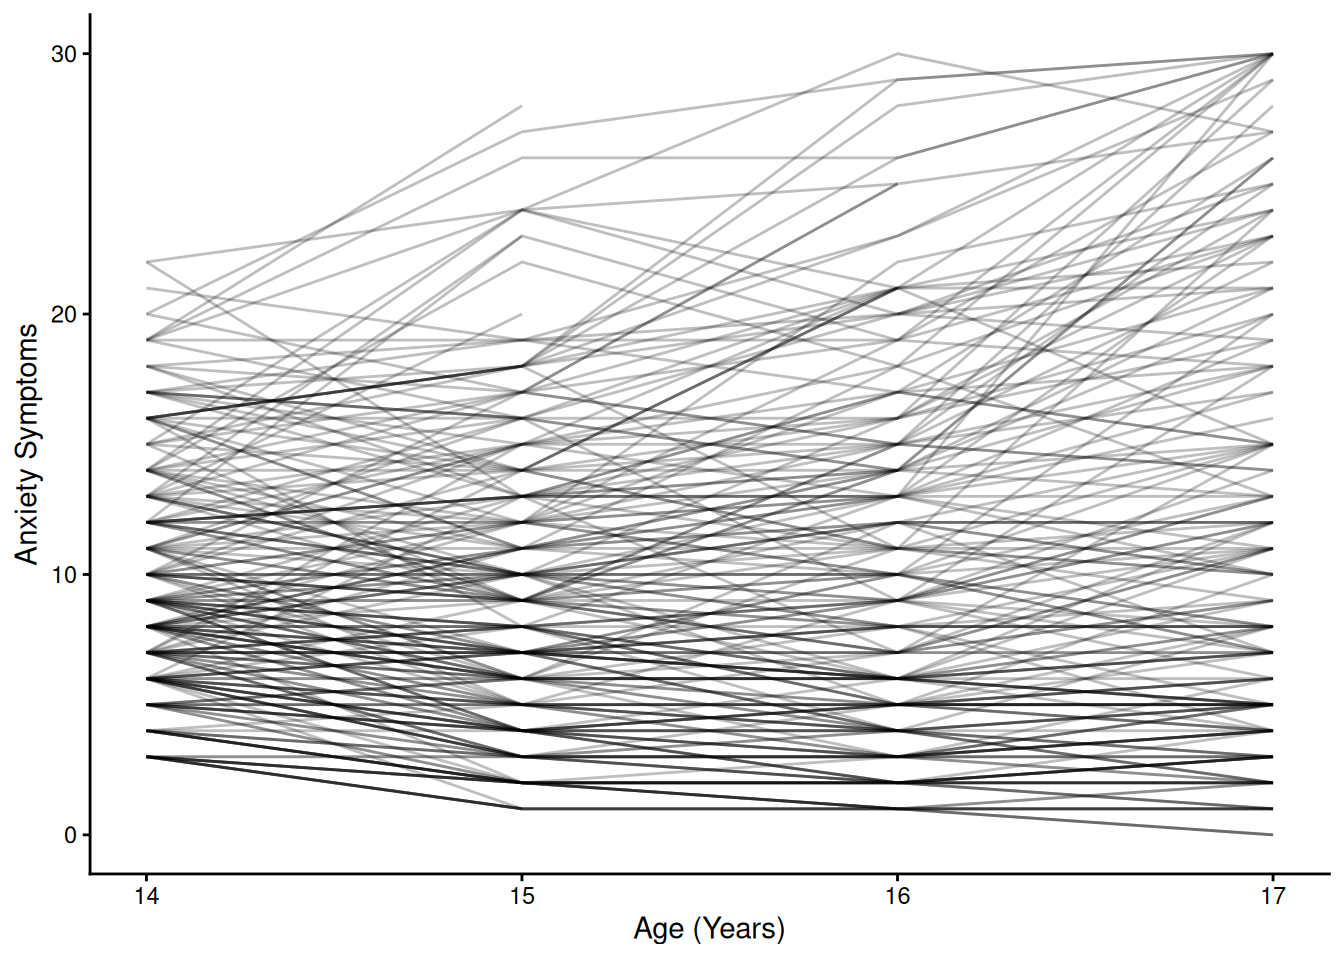
3.2 Overlaid with Means by Sex
Code
ggplot(
  data = mydata_long,
  mapping = aes(
    x = age,
    y = depression,
    group = ID)) +
  geom_line(
    alpha = 0.25
  ) +
  geom_line(
    mapping = aes(
      x = age,
      y = depression,
      color = sexFactor,
      group = sexFactor,
    ),
    data = mydata_long_summary,
    linewidth = 2
  ) +
  labs(
    x = "Age (Years)",
    y = "Depression Symptoms",
    color = "Sex"
  ) +
  theme_classic()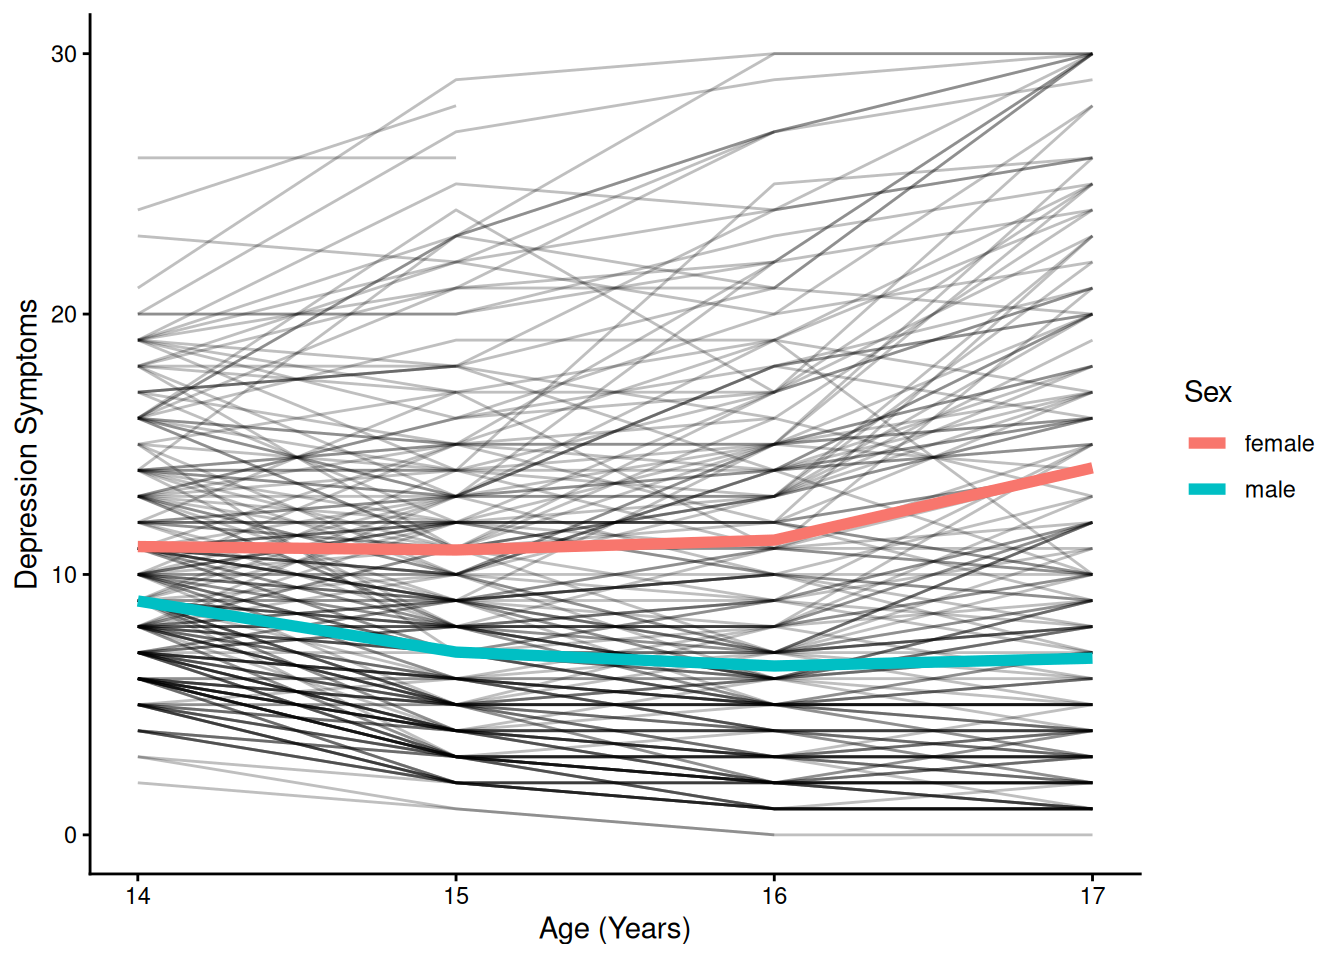
Code
ggplot(
  data = mydata_long,
  mapping = aes(
    x = age,
    y = anxiety,
    group = ID)) +
  geom_line(
    alpha = 0.25
  ) +
  geom_line(
    mapping = aes(
      x = age,
      y = anxiety,
      color = sexFactor,
      group = sexFactor,
    ),
    data = mydata_long_summary,
    linewidth = 2
  ) +
  labs(
    x = "Age (Years)",
    y = "Anxiety Symptoms",
    color = "Sex"
  ) +
  theme_classic()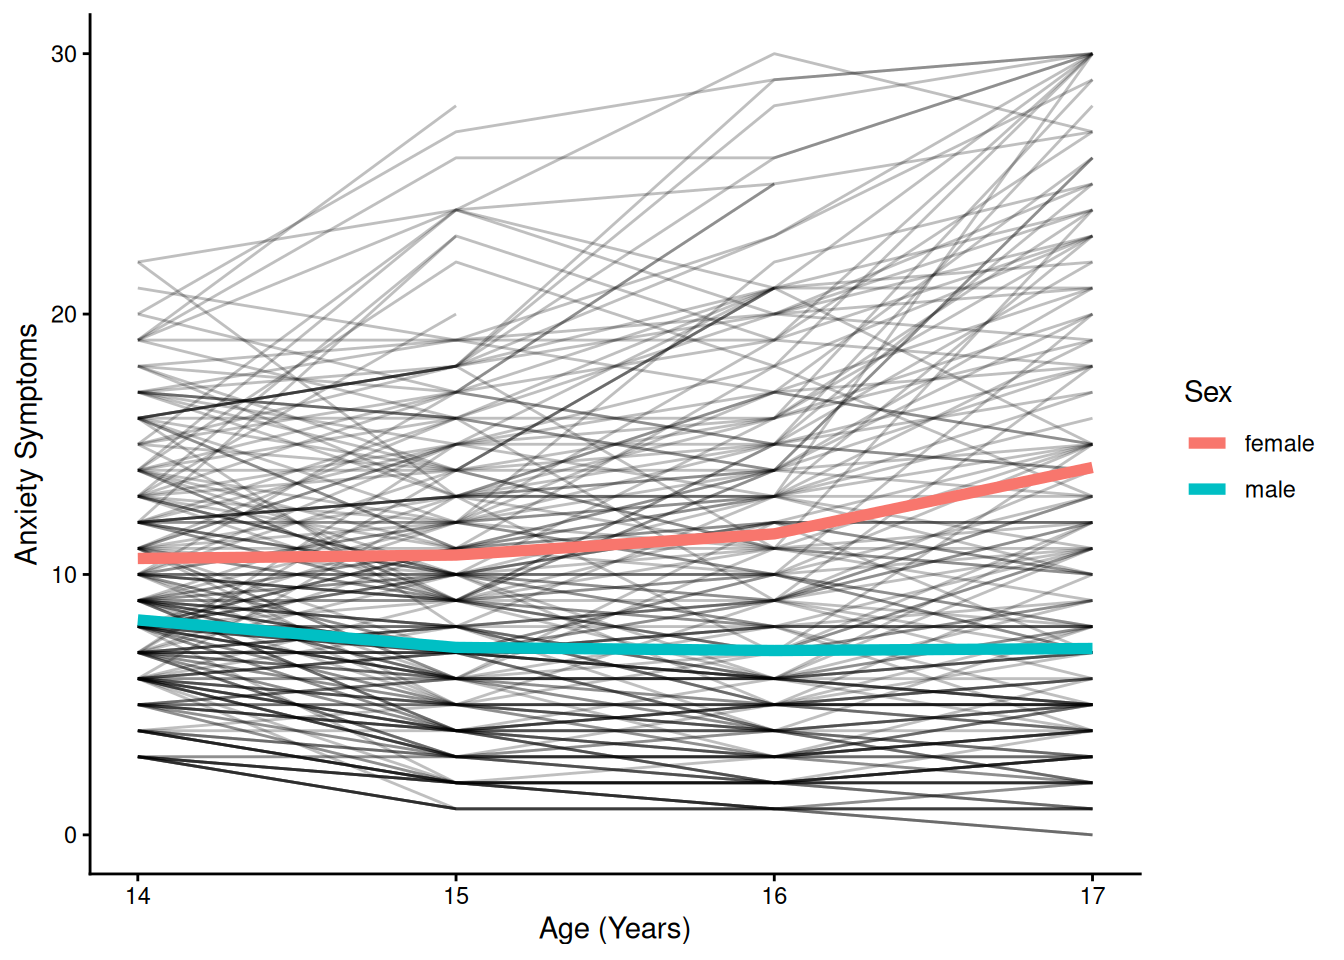
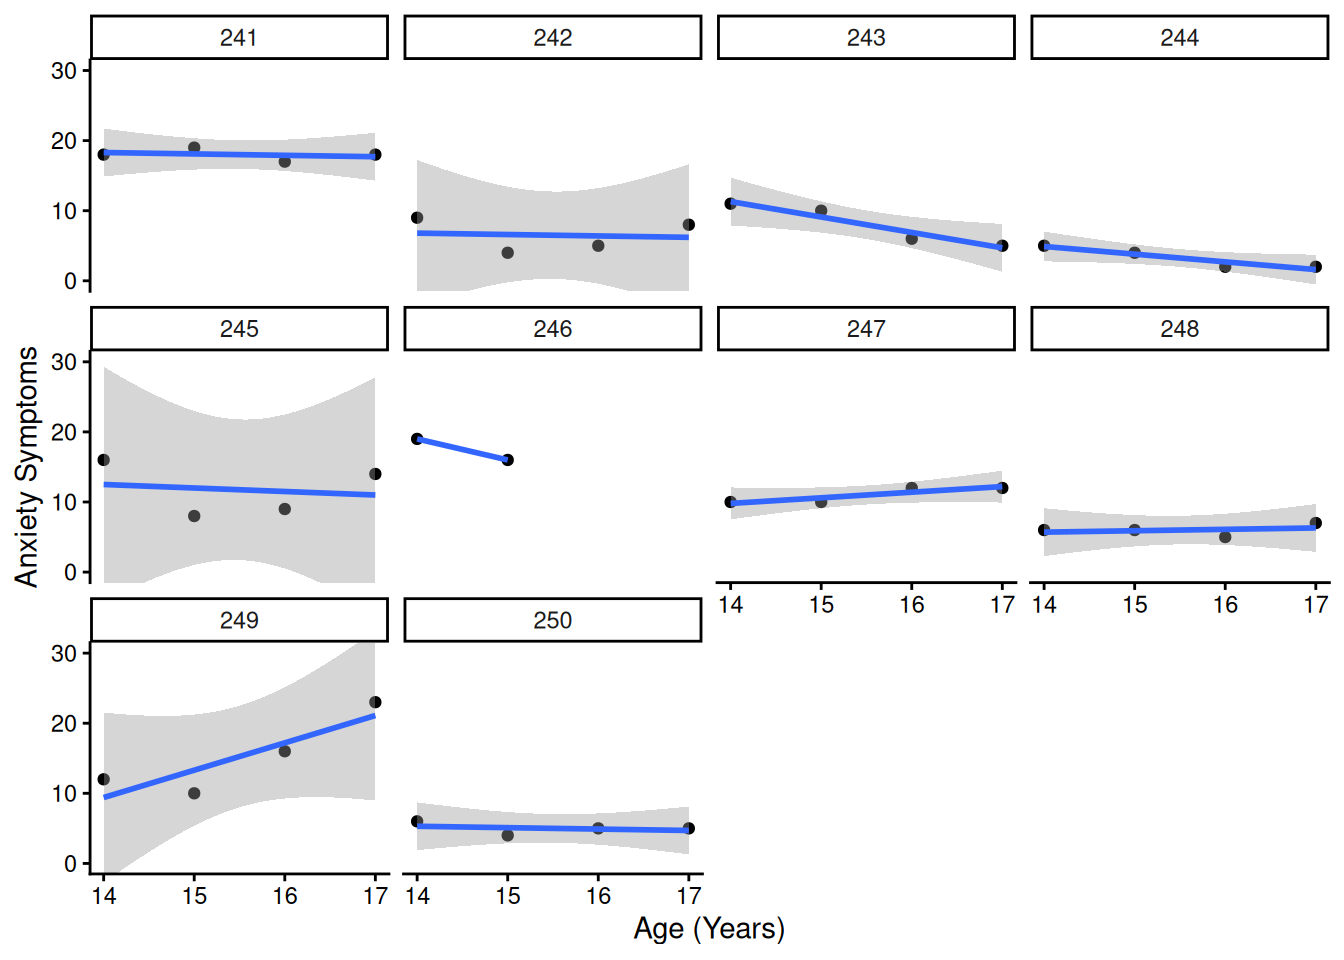
3.3 Faceted Plots
3.3.1 Random Subsample
Code
set.seed(52242) # for reproducibility

random_n <- 12

ids_subset <- sample(
  x = mydata_long$ID,
  size = random_n,
  replace = FALSE
)

mydata_long |>
  filter(ID %in% ids_subset) |>
  ggplot(
    aes(
      x = age,
      y = depression,
      group = ID
    )
  ) +
  geom_point() +
  geom_smooth(
    method = "lm"
  ) +
  coord_cartesian(
    ylim = c(0, max(mydata_long$depression, na.rm = TRUE))) +
  facet_wrap(
    ~ ID) +
  labs(
    x = "Age (Years)",
    y = "Depression Symptoms"
  ) +
  theme_classic()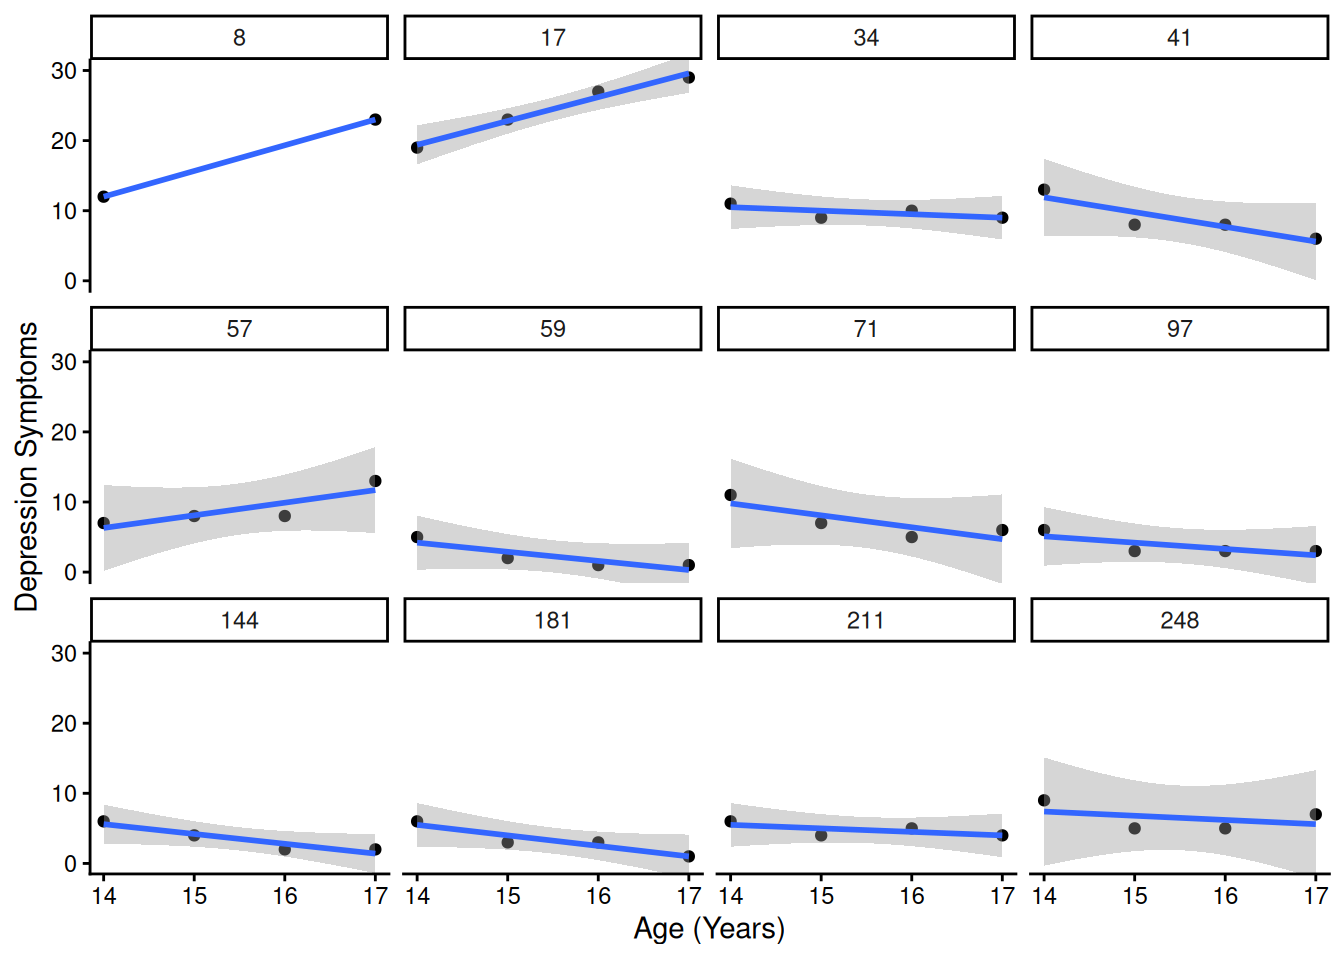
Code
mydata_long |>
  filter(ID %in% ids_subset) |>
  ggplot(
    aes(
      x = age,
      y = anxiety,
      group = ID
    )
  ) +
  geom_point() +
  geom_smooth(
    method = "lm"
  ) +
  coord_cartesian(
    ylim = c(0, max(mydata_long$anxiety, na.rm = TRUE))) +
  facet_wrap(
    ~ ID
  ) +
  labs(
    x = "Age (Years)",
    y = "Anxiety Symptoms"
  ) +
  theme_classic()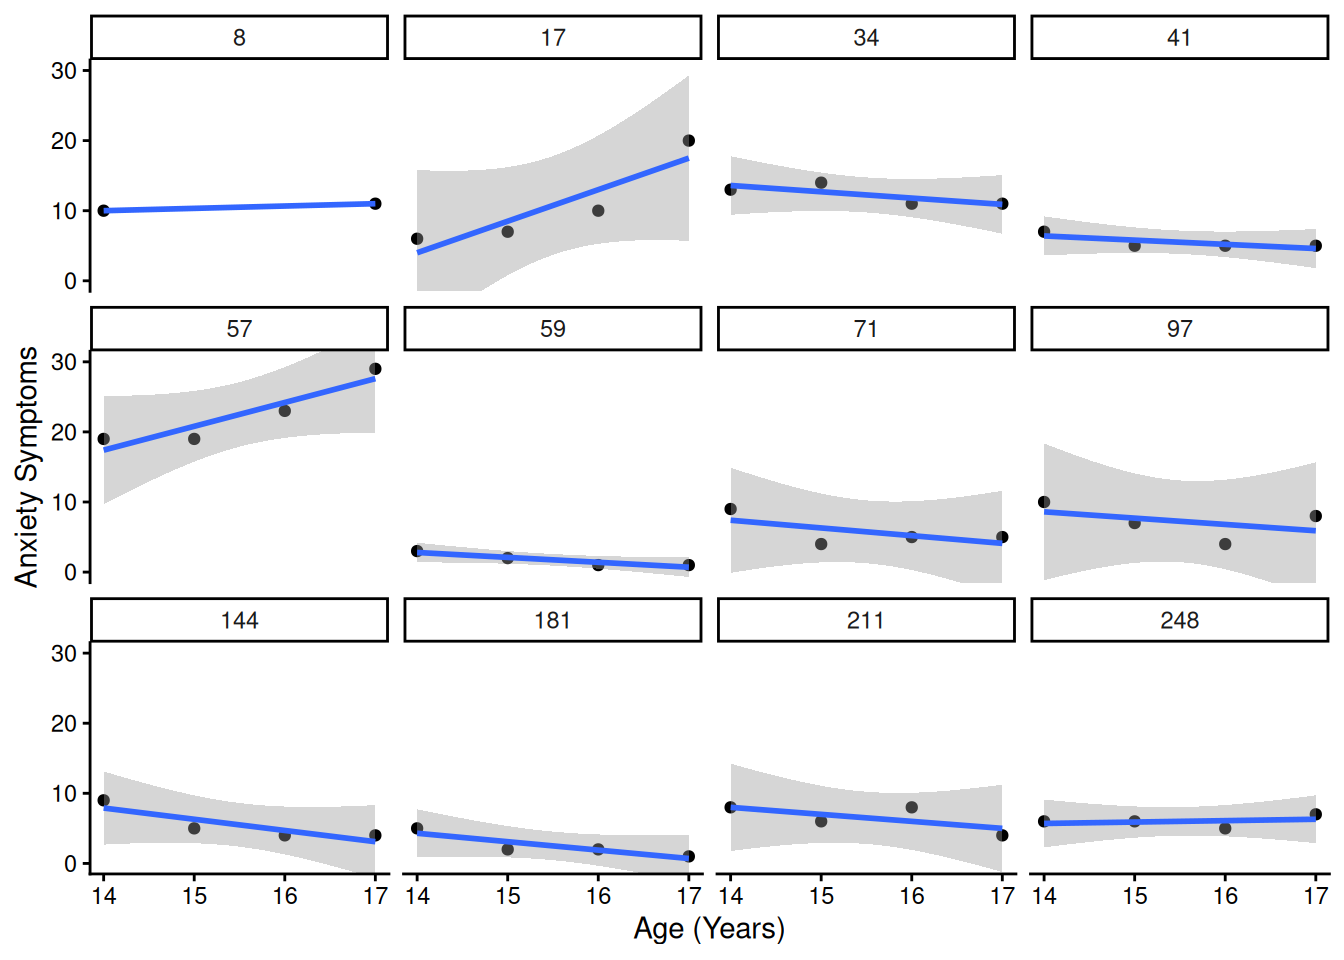
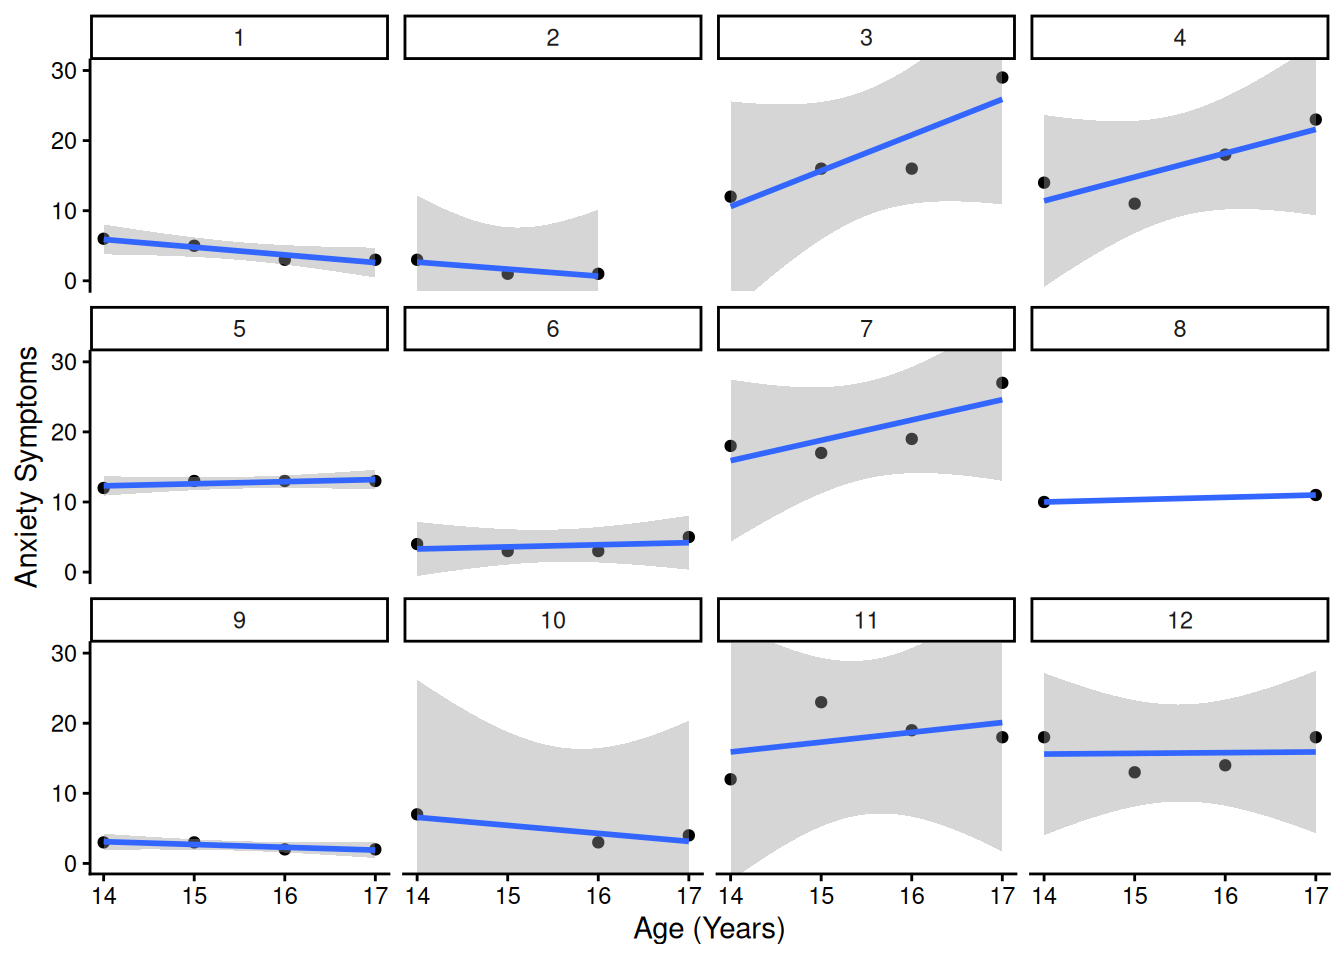
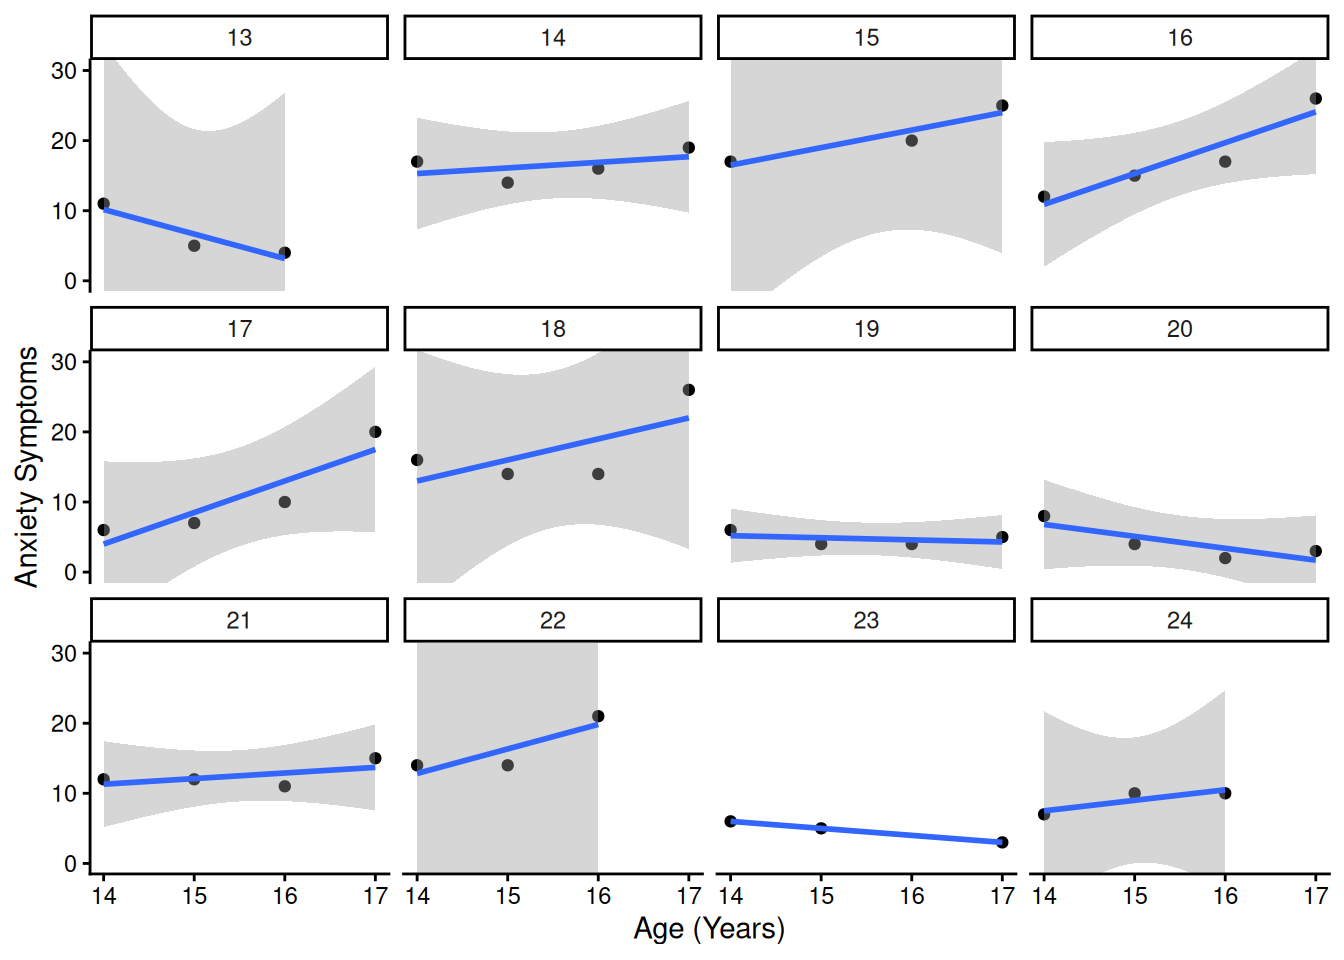
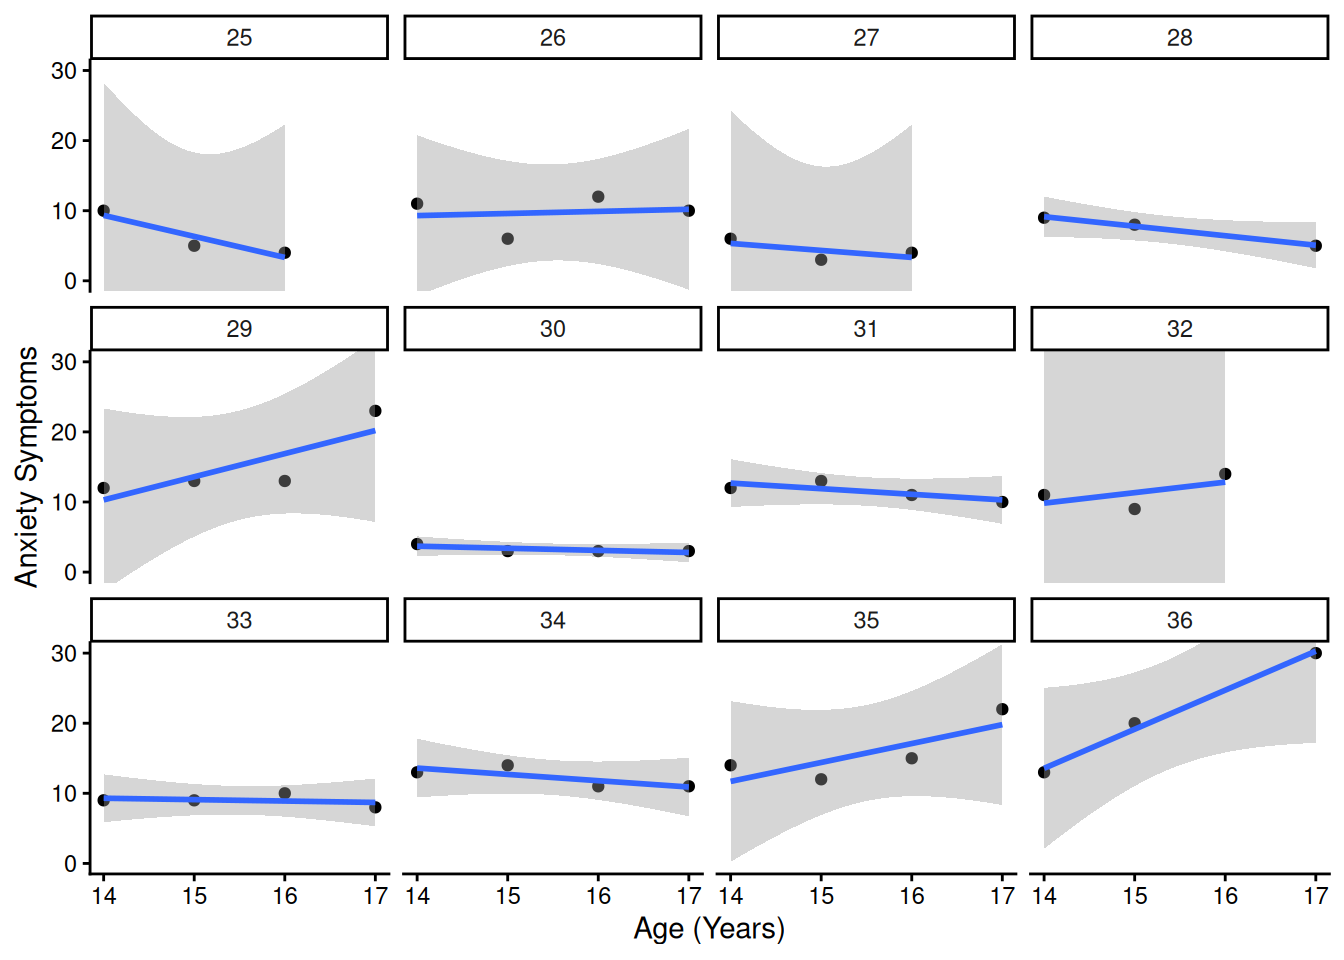
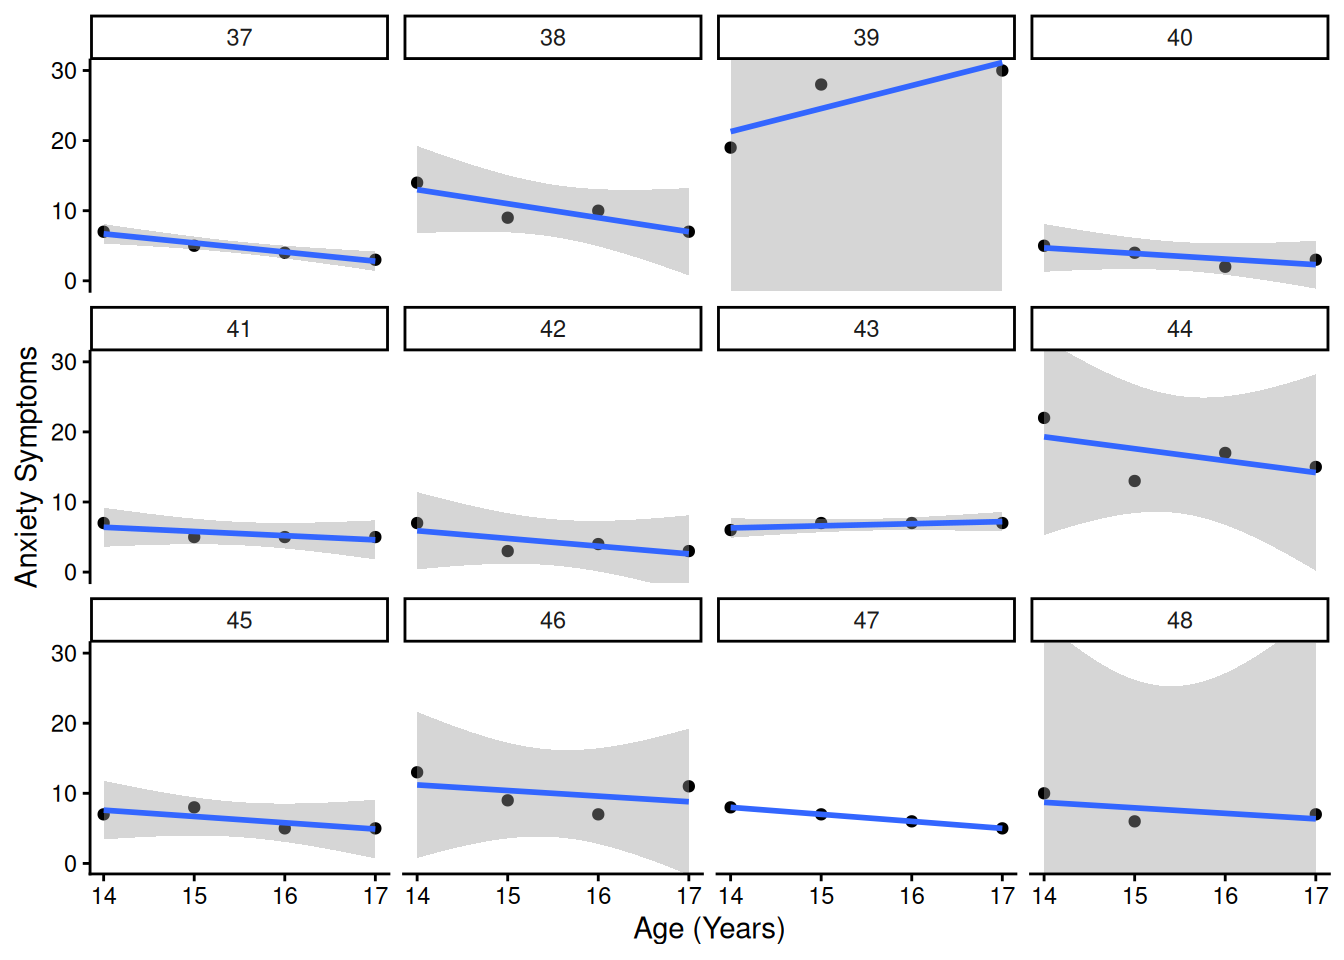
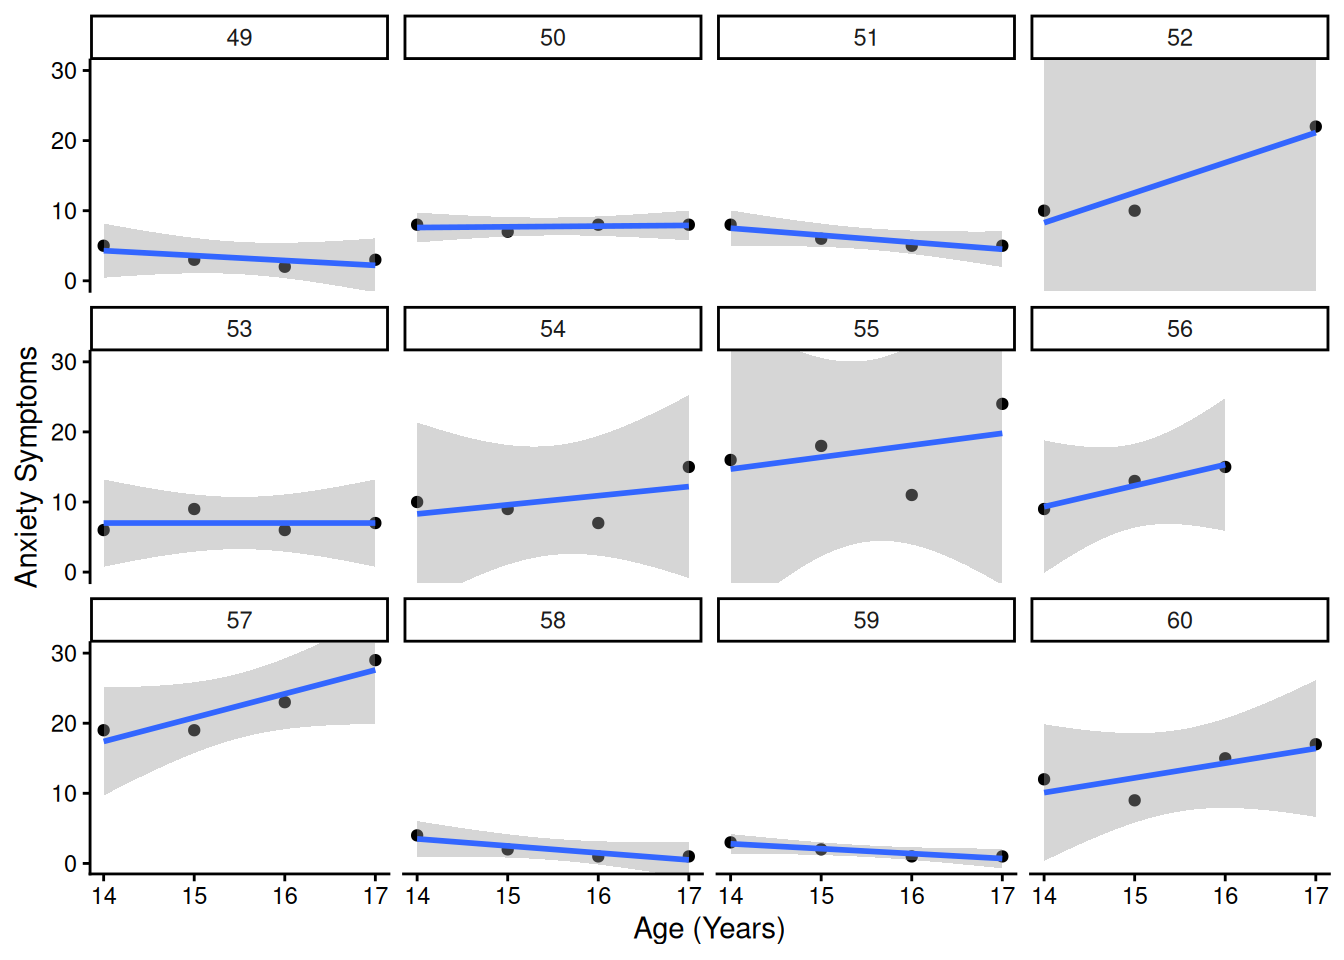
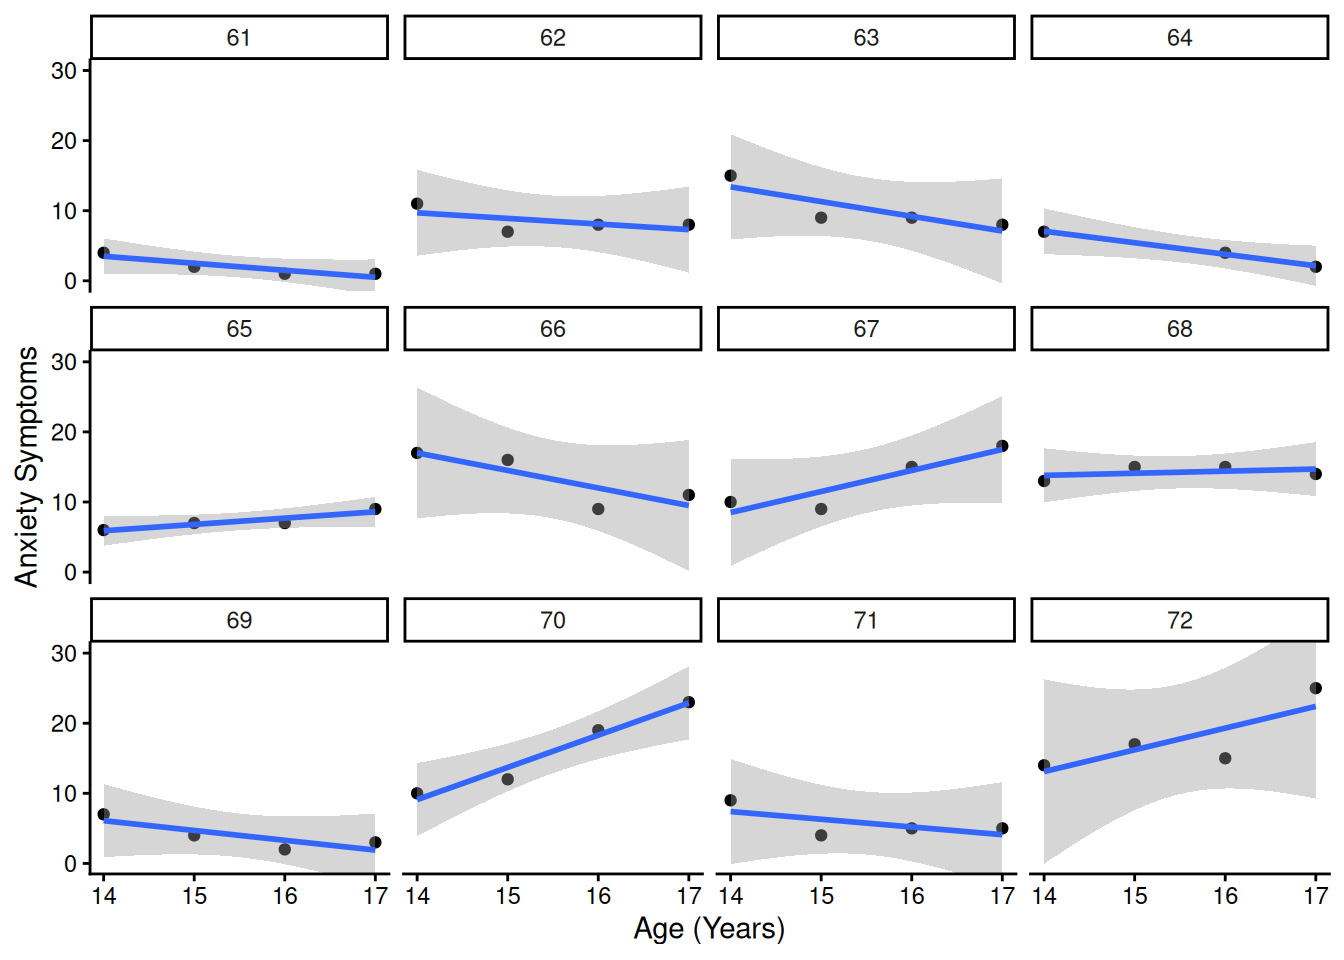
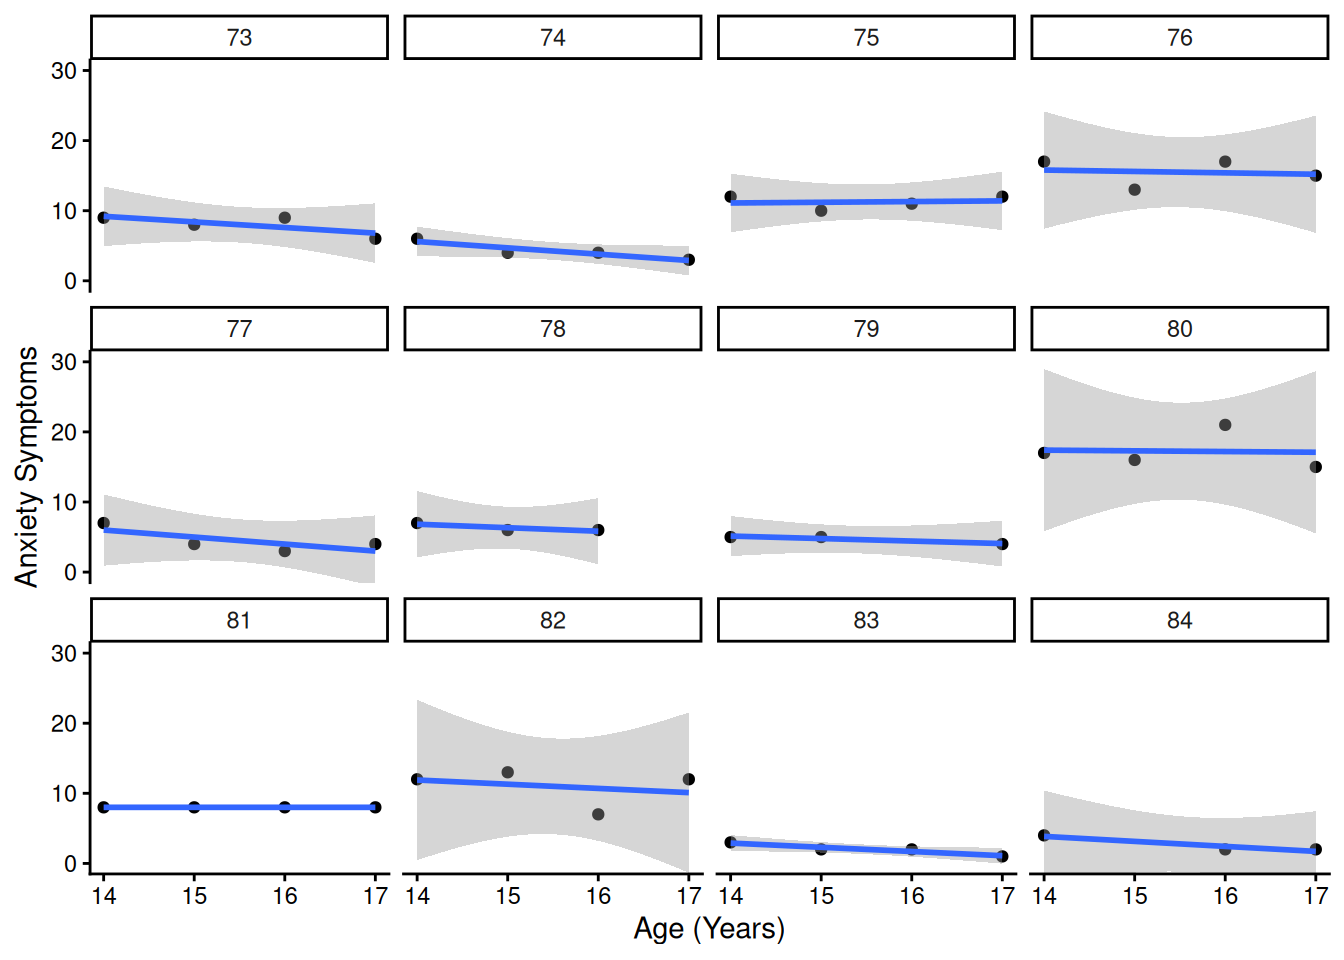
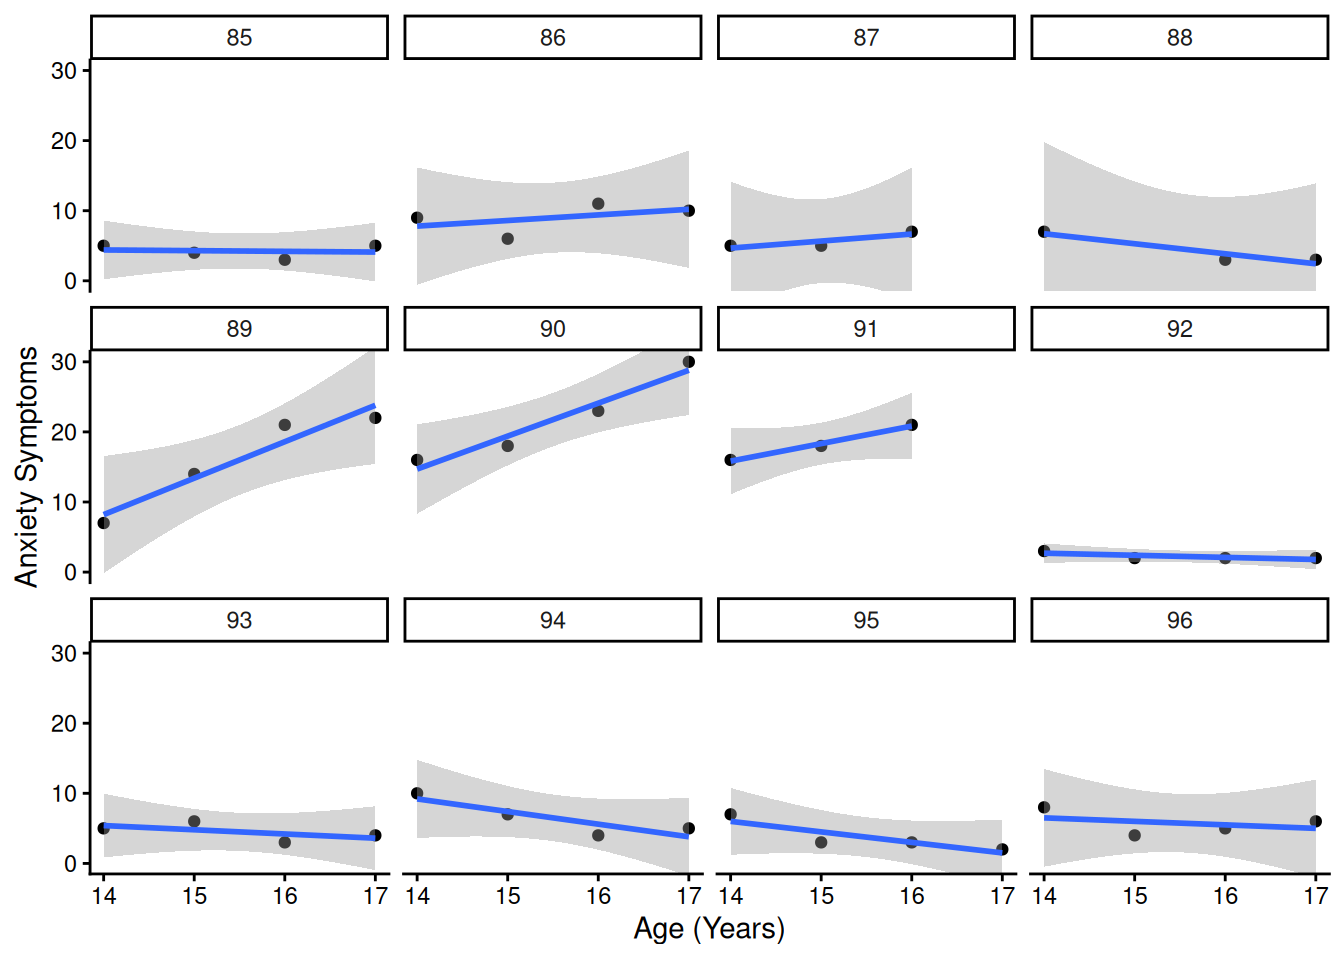
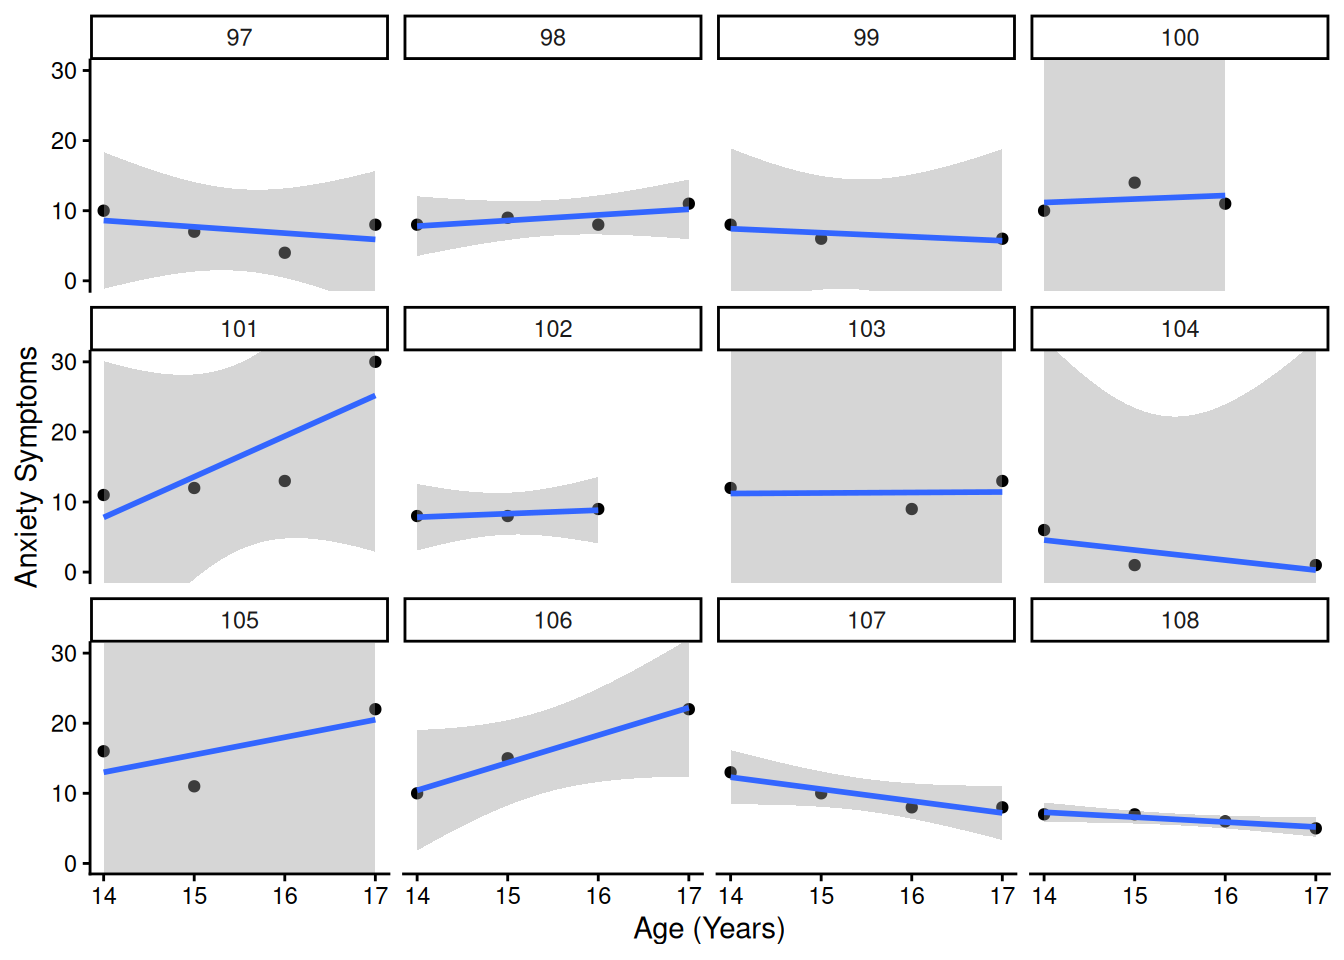
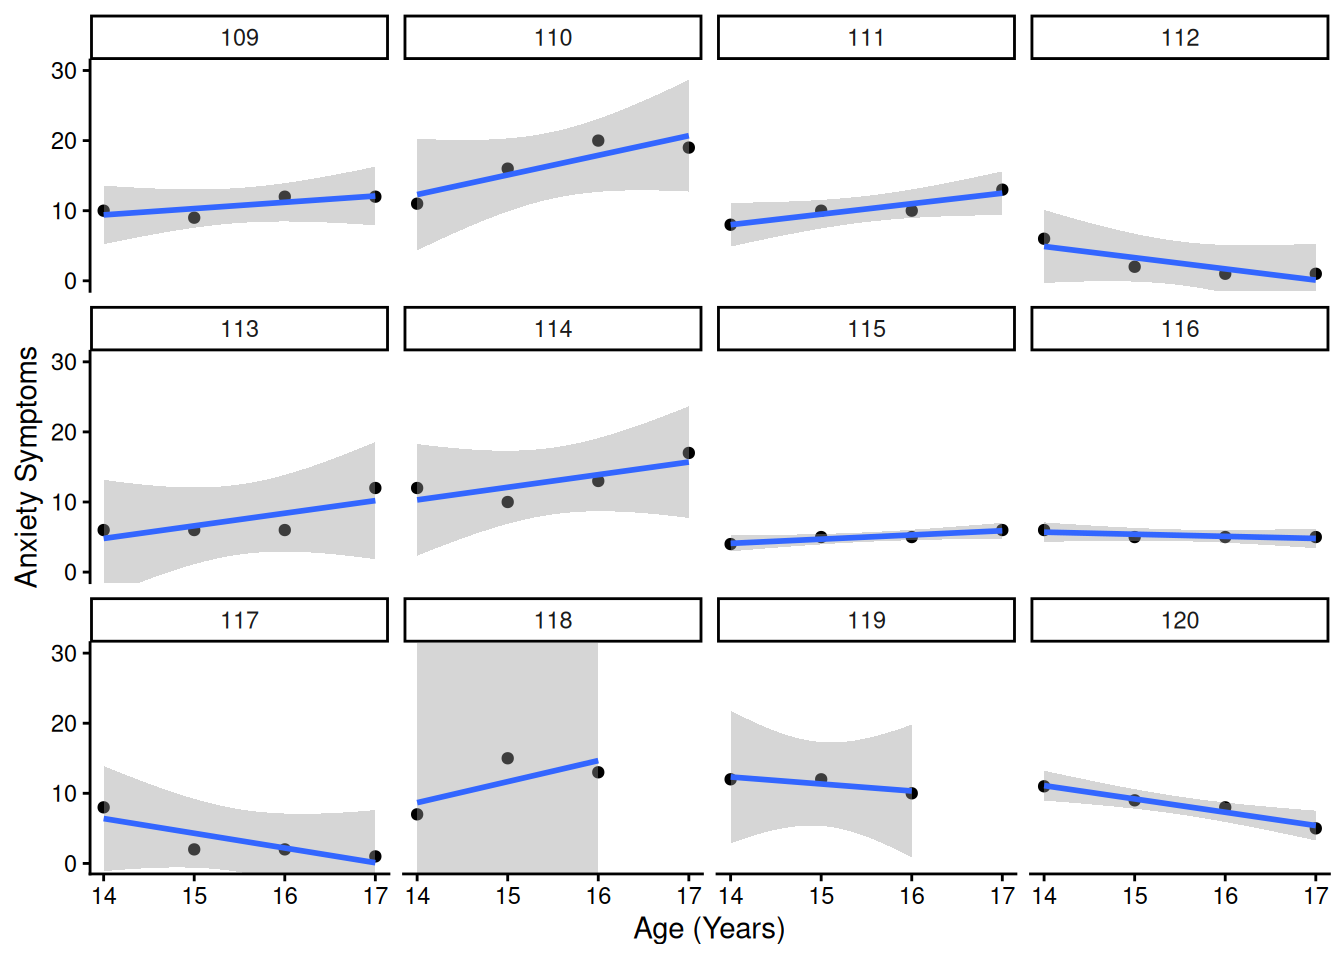
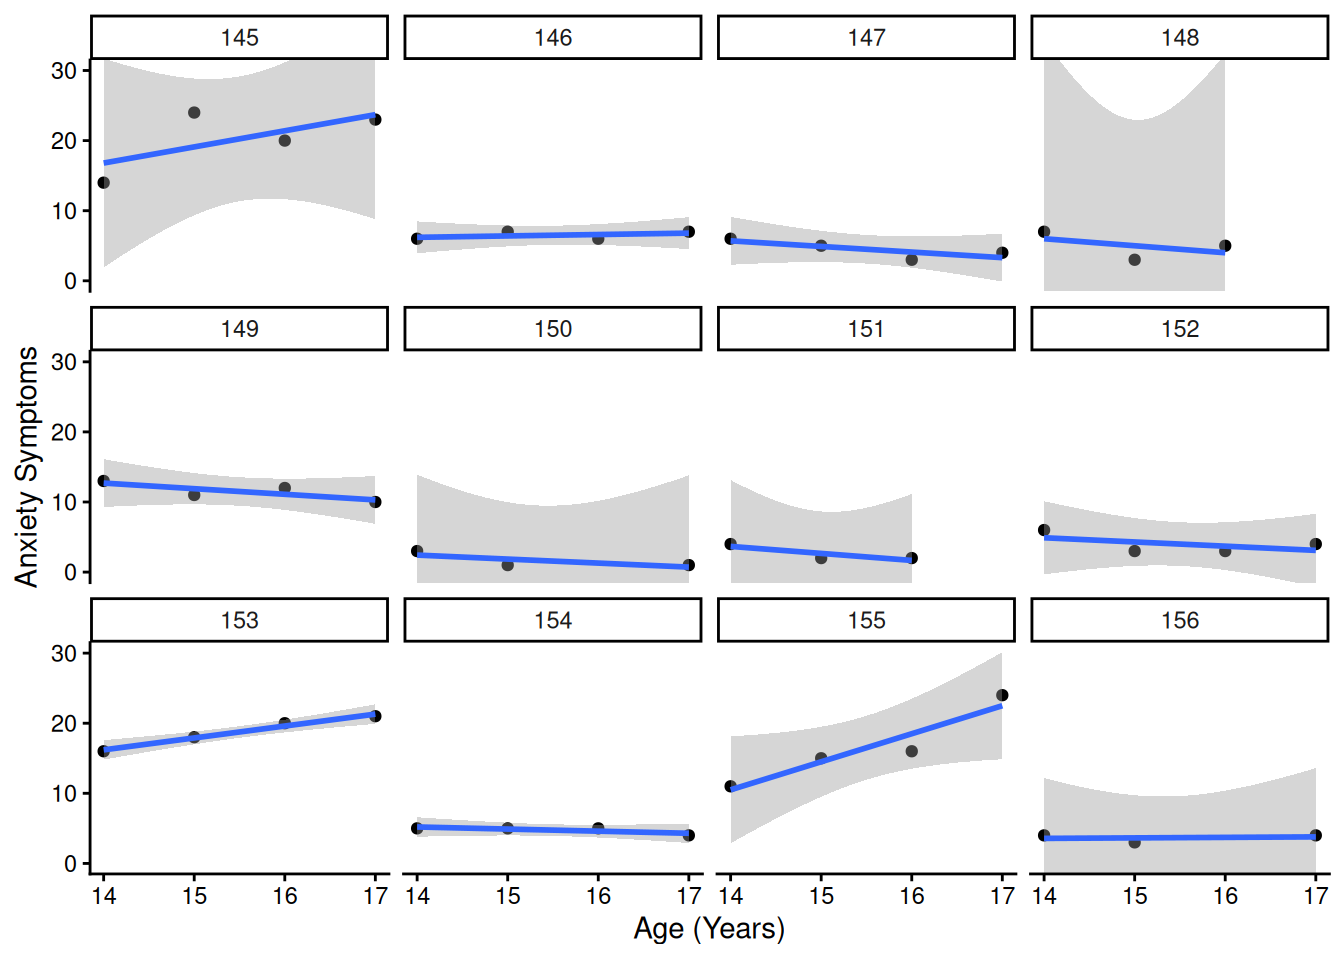
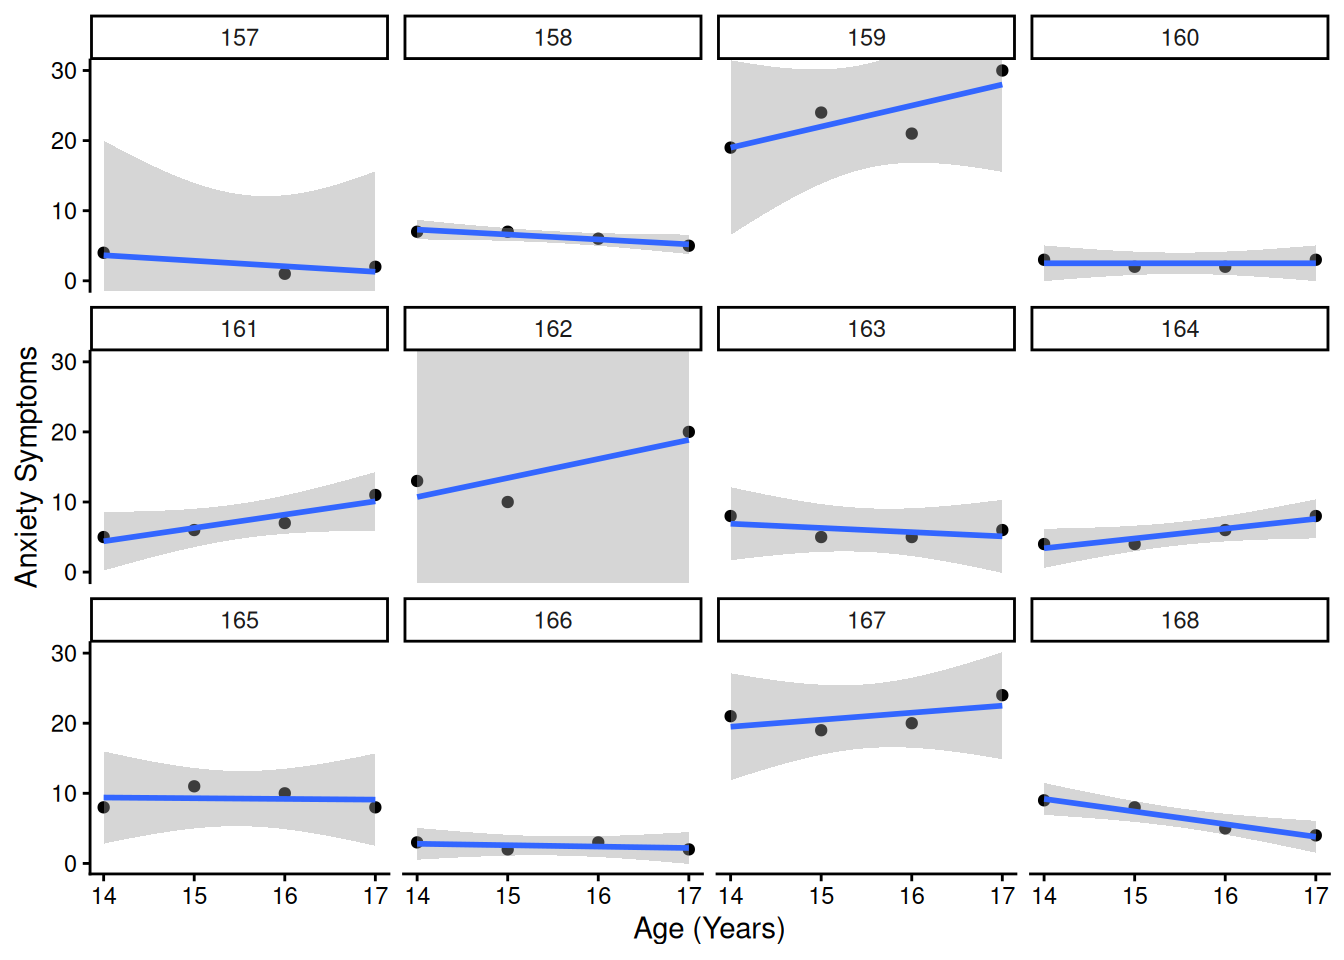
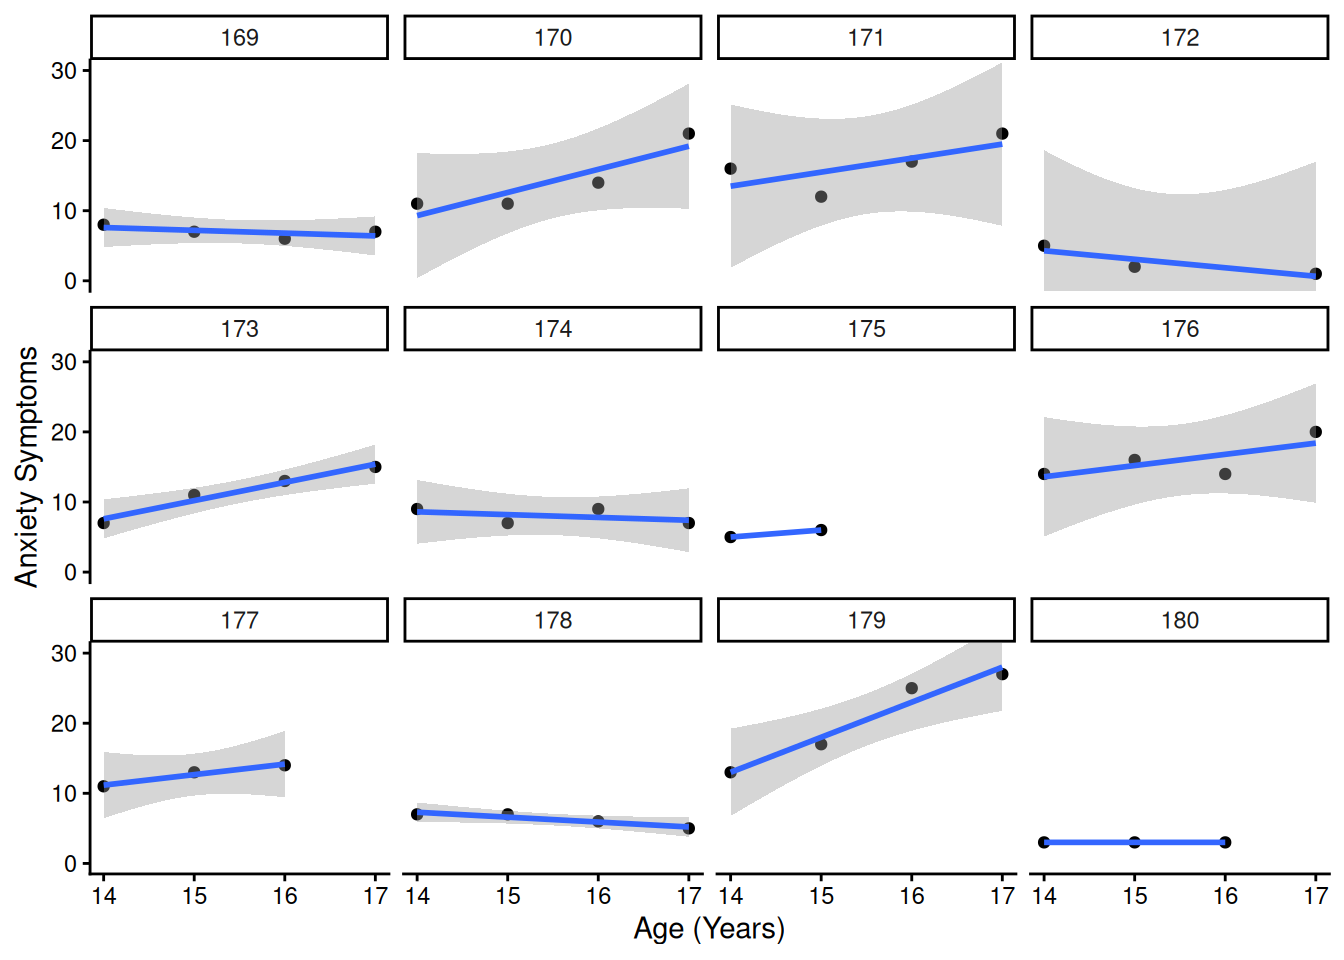
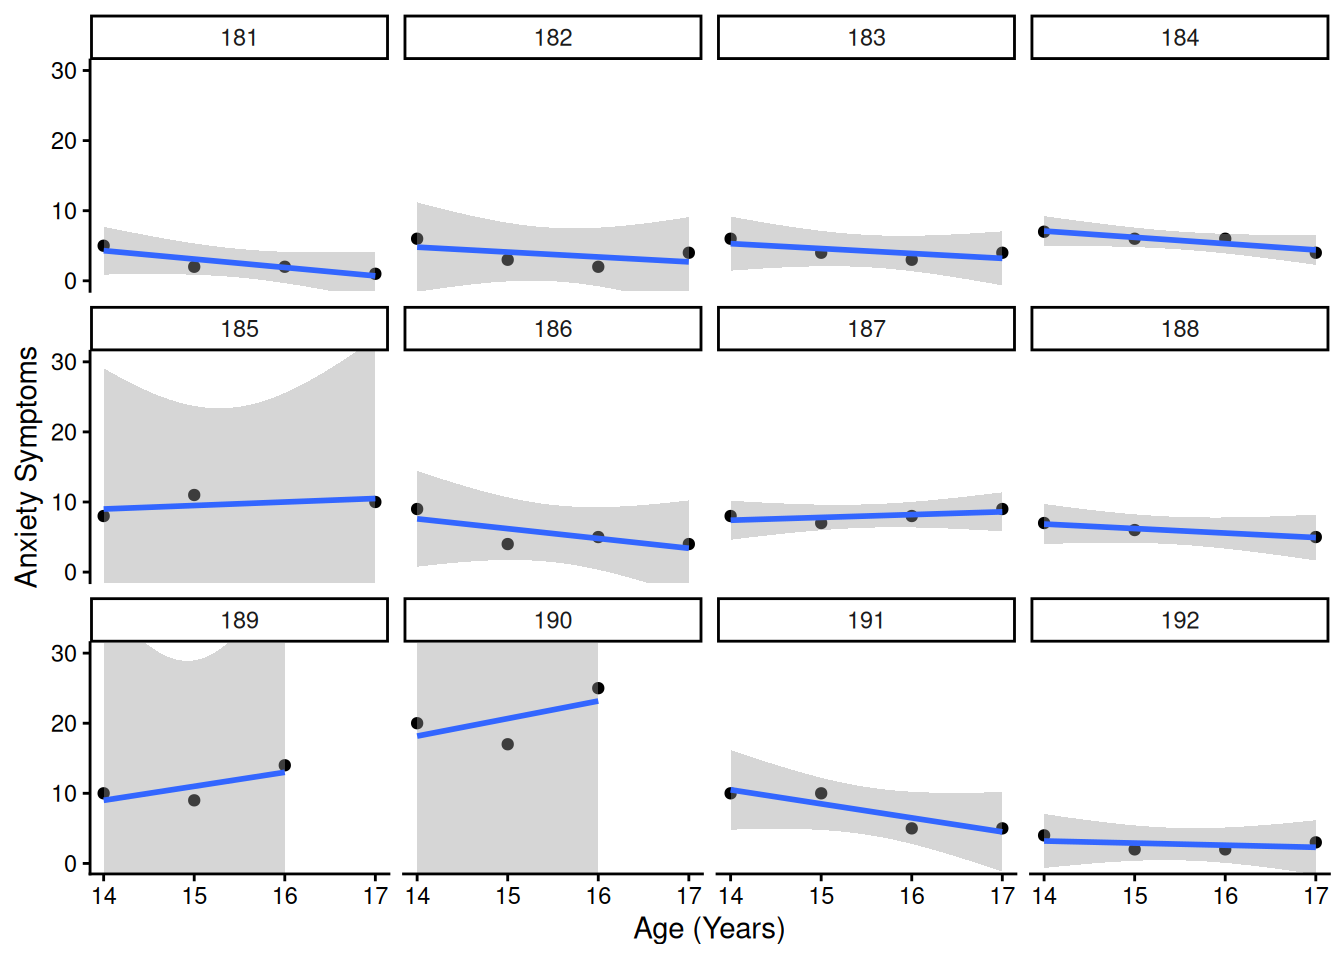
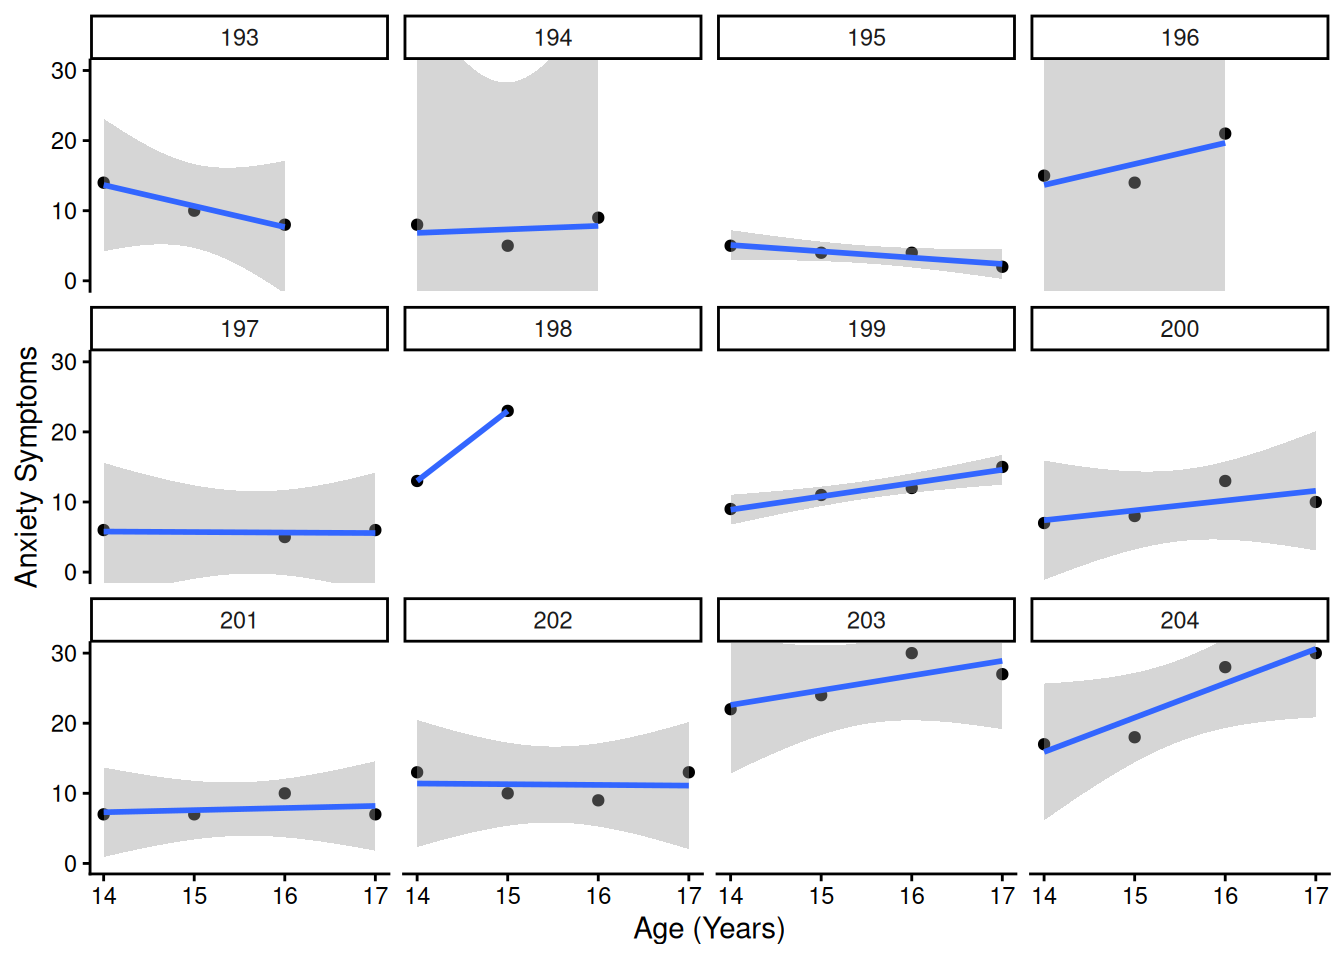
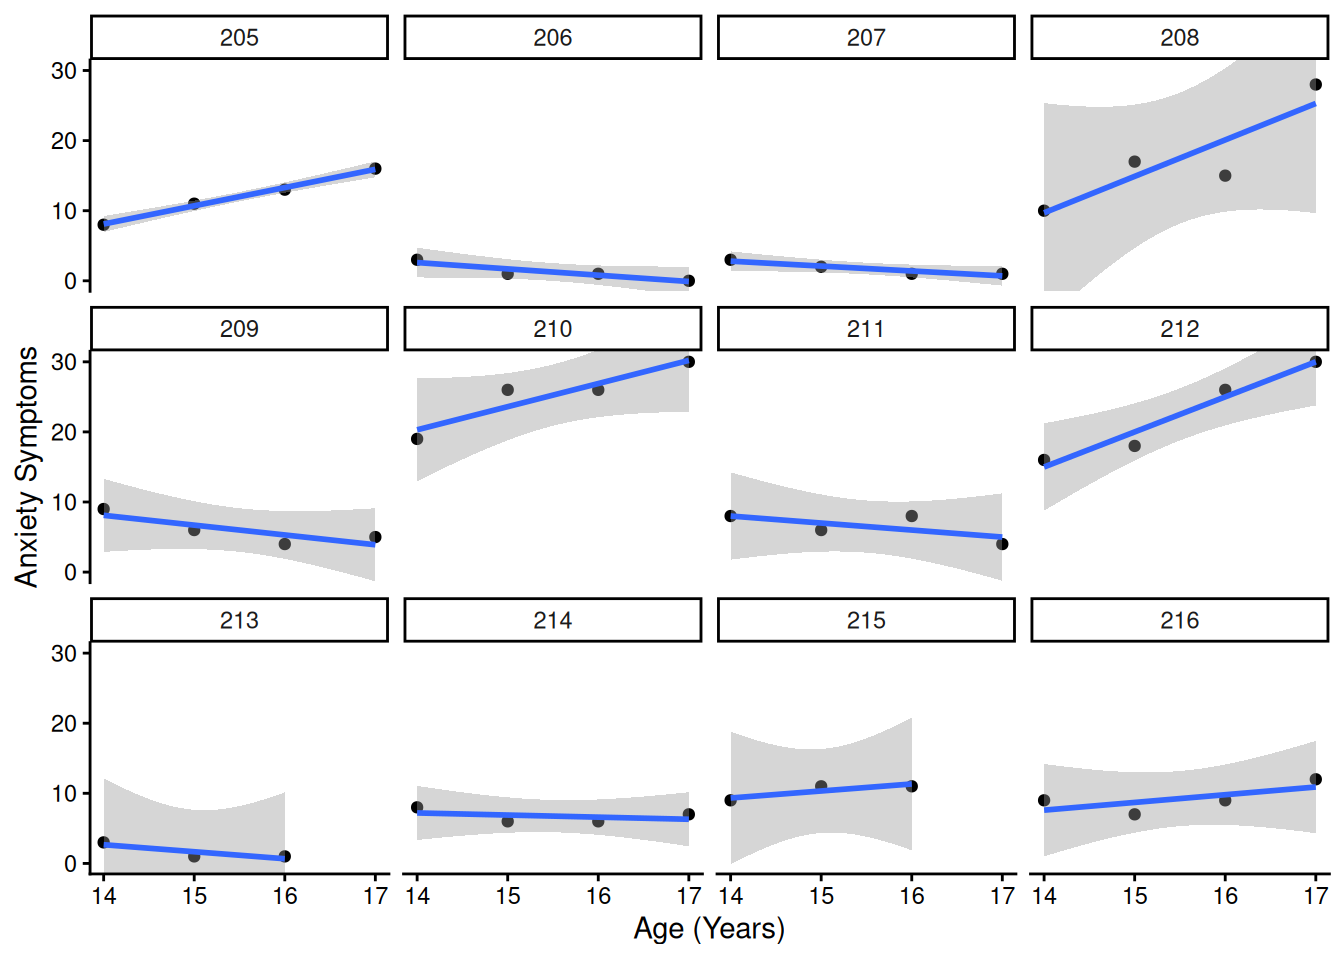
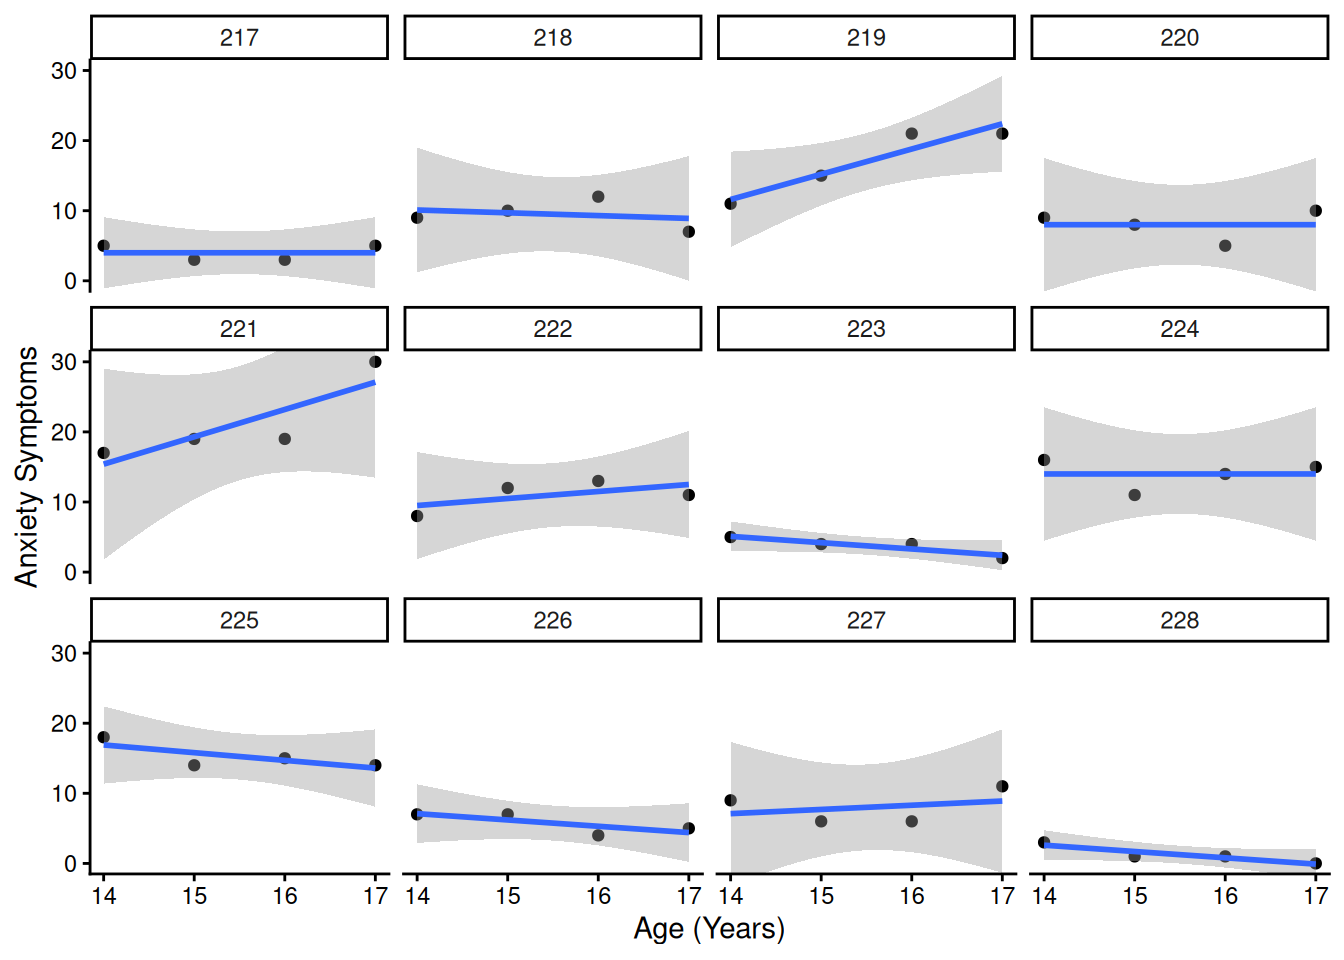
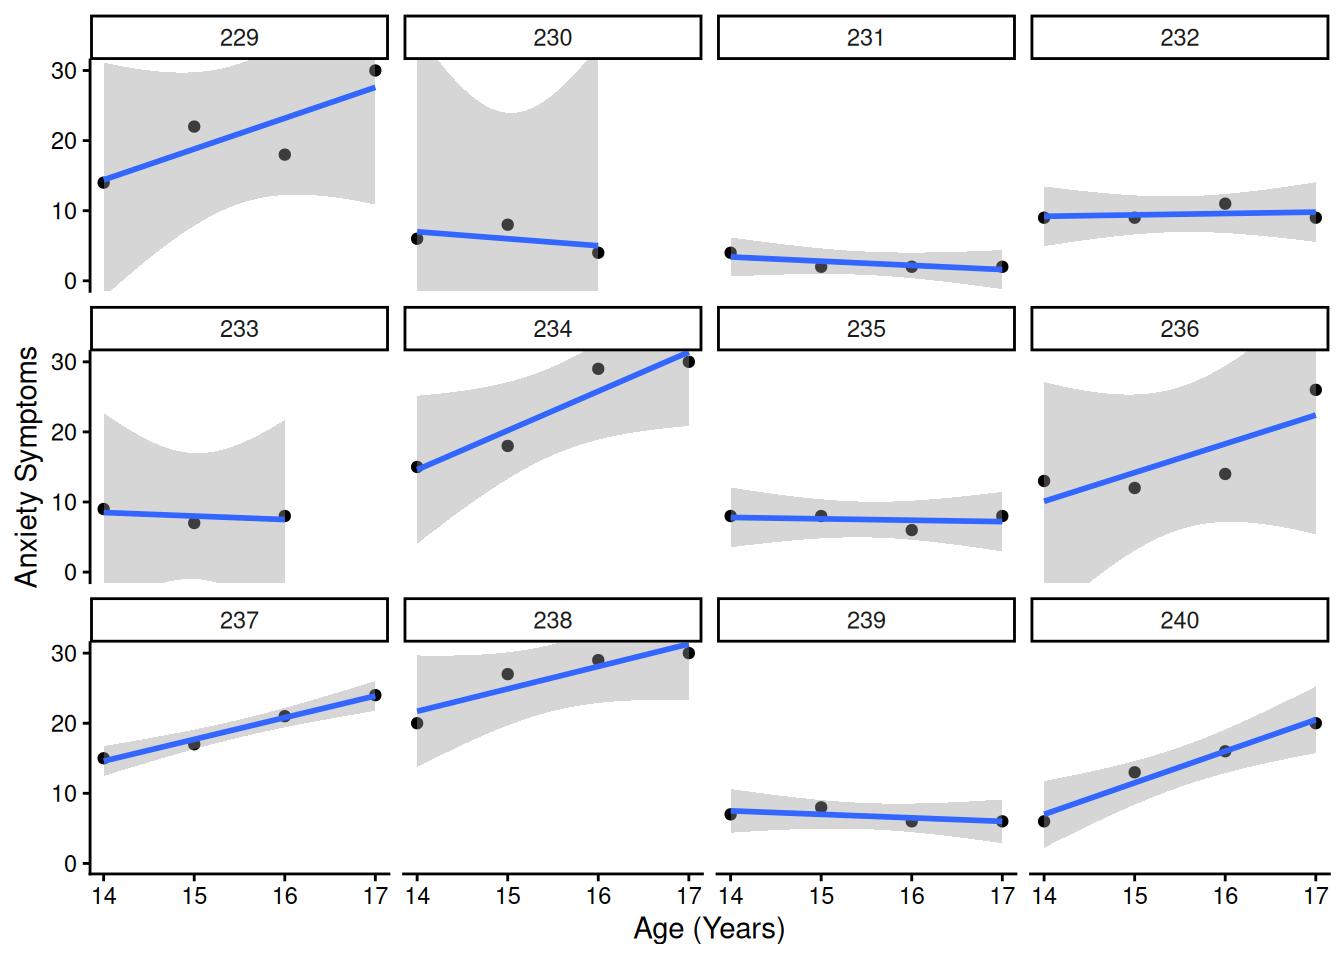
3.3.2 All Cases
Code
facetedPlots <- mydata_long |>
  ggplot(
    aes(
      x = age,
      y = anxiety,
      group = ID
    )
  ) +
  geom_point() +
  geom_smooth(
    method = "lm"
  ) +
  coord_cartesian(
    ylim = c(0, max(mydata_long$anxiety, na.rm = TRUE))) +
  labs(
    x = "Age (Years)",
    y = "Anxiety Symptoms"
  ) +
  theme_classic() +
  ggforce::facet_wrap_paginate(
    ~ ID,
    ncol = 4,
    nrow = 3)

num_pages <- ggforce::n_pages(facetedPlots)

for(i in 1:num_pages){
  print(facetedPlots +
    ggforce::facet_wrap_paginate(
      ~ ID,
      ncol = 4,
      nrow = 3,
      page = i))
}