Code
[1] 0.04784689I want your feedback to make the book better for you and other readers. If you find typos, errors, or places where the text may be improved, please let me know. The best ways to provide feedback are by GitHub or hypothes.is annotations.
Opening an issue or submitting a pull request on GitHub: https://github.com/isaactpetersen/Principles-Psychological-Assessment
Adding an annotation using hypothes.is.
To add an annotation, select some text and then click the
symbol on the pop-up menu.
To see the annotations of others, click the
symbol in the upper right-hand corner of the page.
I was initially hesitant to include a chapter titled “evidence-based assessment” because this whole book is about doing assessment in the strongest, most scientifically supported (i.e., evidence-based) ways. However, I decided to include a chapter on evidence-based assessment to summarize many of the important considerations in ensuring our assessments are strong for their intended uses, especially in clinical psychology, and to discuss the value of some cutting-edge (and some not-so-cutting-edge) techniques to maximize the validity of inferences. A case study in evidence-based assessment is provided by Antony & Rowa (2005).
In general, we need to use assessment devices that are:
Effective treatment depends on accurate assessment. Thus, it is important to consider the treatment utility of assessment to determine whether the assessment has value. Several study methods were designed to examine the treatment utility of assessment, including manipulated assessment (compares assessment versus no assessment) and manipulated use (compares use versus no use of data from the assessment for treatment matching).
It is also important to consider the ease of dissemination of an assessment: is it time- and money-efficient, especially in terms of its cost–benefit ratio? Brief assessments, computerized testing, and adaptive testing can help assessments be clinically practical. It should be straightforward to score and interpret. And it should provide incremental validity, i.e., additional useful information above and beyond what is gained by other assessment devices.
We have already discussed how assessments can yield more effective outcomes indirectly through matching the right treatment approach to the client. It is also worth noting, however, that assessments can also lead directly to improved treatment outcomes. Conducting an assessment is an intervention—it can have carryover effects, and can result in self-reflection, self-awareness, and reactivity, i.e., change due to observing it.
Assessment is also an important component of measurement-based care. Measurement-based care is the approach of treatment monitoring and modifying treatment accordingly (Lutz et al., 2022). Assessment does not stop at the beginning of the treatment—it is continuous and ongoing. So, ongoing measurement is recommended throughout treatment so that the clinician can modify the treatment in response to measurements. Assessment of treatment progress needs to be sensitive to change, i.e., the assessment needs to show treatment sensitivity, and it needs to be actionable, i.e., it needs to have utility.
In clinical psychological assessment, it is important for assessments to:
In addition, it is valuable to:
It is important to mitigate cultural bias of instruments. It is also important for the measure to be useful across the population of interest. To accomplish this, one may have to modify an assessment approach to account for clinically significant moderating variables. We discuss culturally sensitive assessment more in Chapter 25, and we discuss test bias in Chapter 16.
The development and selection of measures should be based on scientifically supported theories in psychopathology and basic psychological science. Measures should be standardized, with similar procedures across participants, clients, and examiners.
Reliability and validity of measures’ scores are specific to a particular use of the test, and are specific for a given population and context. So, it is important to clearly specify the purpose of the assessment. As just a few examples, the purpose of the assessment could be screening for early identification of risk, for diagnosis, for treatment monitoring, for treatment evaluation, or for measuring a phenomenon of interest in research. In general, the purposes of an assessment can be summarized into the 3 Ps (Youngstrom et al., 2017): predict, prescribe, and process. The purpose of an assessment is to predict if the purpose is to relate an assessment to a criterion at a later point in time. An assessment is used to prescribe if it informs decision-making about the participant or client—for example, a decision about which treatment to give, identifying moderators of treatment effectiveness, or specifying potential confounds or alternative explanations that would warrant a different treatment. An assessment is used to understand process if it informs understanding of the participant or client—for example, identifying mediators of treatment effectiveness or tracking treatment progress.
Whichever the purpose of the assessment, it is important to test and evaluate the psychometrics of the assessment device for that particular purpose. Only use the assessment device in a test battery if it advances that purpose. Youngstrom et al. (2017) describe the different core psychometric features that are especially relevant for each purpose. For instance, predictive and discriminative validity are crucial for prediction, whereas inter-rater reliability is crucial for prescription, and treatment sensitivity—a form of criterion-related validity—is crucial for understanding process.
Additionally, when making norm-referenced judgments, it is important that the assessment has appropriate norms and evidence of accuracy for any cut-scores (e.g., diagnostic thresholds). Per Youngstrom et al. (2017), below are the norms and psychometric standards for excellent tests:
The whole assessment process should be empirically evaluated, including the selection, administration, scoring, and interpretation of an instrument, the integration of multiple sources of assessment data, and the decision-making process. When possible, it is valuable to evaluate the accuracy of the decision-making, ideally against some gold standard, for quality control improvement.
In general, it is better to include a wide range of assessment tools than a single strong measure. For instance, assessment tools could include self- and informant-report questionnaires, interviews, self-monitoring diaries, behavioral observation, performance-based techniques, and psychophysiological techniques. Then, each measure can be weighted according to its diagnostic likelihood ratio—i.e., its concurrent/predictive validity in the form of the positive likelihood ratio.
One challenge is how to handle a situation where different instruments yield different answers. For instance, if the results from parent report versus teacher report conflict with each other. To address potential discrepancies, one can weight the different instruments or informant sources according to their predictive accuracy. For instance, you might give more weight to youths’ self-report for assessing anxiety but might give more weight to parent report for assessing ADHD. One way to handle informant discrepancies when there is not a clear primary informant who is best-positioned to rate the person most accurately is to count a symptom as present if it is endorsed by any of the informants (Hinshaw & Nigg, 1999). Alternatively, one can use a trifactor model to separate the effects of construct, item, and informant (Bauer et al., 2013; Shin et al., 2019), where construct reflects the “general” factor and “item” and “informant type” (e.g., parent, teacher, self) are two cross-cutting method factors. A trifactor model is similar to (and an extension of) a bifactor model; however, each rating loads onto three latent sources (in this case, construct, item, and informant type). Nevertheless, simpler models that include all informants often outperform (in terms of predictive validity) more complex models that integrate scores across informants, suggesting that each informant (e.g., parent, teacher, self) has an important perspective and provides valuable information (Aitken et al., 2024).
As presented in Equation 9.16, the posttest (or posterior) odds are equal to the pretest odds multiplied by the likelihood ratio. Bayes’ theorem is discussed in Section 9.1.1.3. Using this formula, and converting odds to probabilities, we can use a Fagan probability nomogram to determine the posttest probability following a test result. The calculation of posttest probability is described in Section 9.5.32. A probability nomogram is a way of visually applying Bayes’ theorem to determine the posttest probability of having a condition based on the pretest (or prior) probability and likelihood ratio, as depicted in Figure 12.1. To use a probability nomogram, connect the dots from the starting probability (left line) with the likelihood ratio (middle line) to see the updated probability. The updated (posttest) probability is where the connecting line crosses the third, right line.
).](images/probabilityNomogram.png)
For instance, if the starting probability is .5% and the likelihood ratio is 10 (e.g., sensitivity = .90, specificity = .91: \(\text{likelihood ratio} = \frac{\text{sensitivity}}{1 - \text{specificity}} = \frac{.9}{1-.91} = 10\)), the updated probability is less than 5%, as depicted in Figure 12.2. The formula and function for computing posttest probability are provided in Section 9.5.32. The petersenlab package (Petersen, 2025) contains the posttestProbability() function that calculates the posttest probability from the base rate and the likelihood ratio.
[1] 0.04784689)](images/probabilityNomogramLine.png)
A probability nomogram calculator can be found at the following link: http://araw.mede.uic.edu/cgi-bin/testcalc.pl (archived at https://perma.cc/X8TF-7YBX).
The Diagnostic and Statistical Manual of Mental Disorders (DSM) takes primarily a categorical approach to psychopathology—it classifies mental disorders as discrete categories. That is, anxiety is classified as a distinct disorder from depression in the DSM, despite their strong covariation and co-occurrence. Moreover, disorders are generally classified in the DSM in a binary fashion—according to the DSM, you either “have” the disorder or “do not have” the disorder—there is no middle ground, and there is not a finer differentiation among those who are given the disorder.
Despite the categorical approach of the DSM, most disorders seem to be more accurately conceptualized as dimensional than categorical (Markon et al., 2011). As described in Section 17.5.2, DSM disorders are fictive categories. They do not carve nature at its joints. Many disorders show high comorbidity with other disorders. Transdiagnostic dimensions can better account for the heterogeneity within and across disorders—and more parsimoniously—than DSM categories. For instance, depression and anxiety may share an underlying construct of negative emotionality. A dimensional approach considers a person’s level on each dimension, even if the person is sub-threshold. Moreover a transdiagnostic approach may afford greater flexibility in treatment across disorders by focusing on dimensions of difficulties that may cut across traditional diagnostic boundaries. For instance, the Unified Protocol is a form of psychotherapy designed to address a range of emotional disorders, not just depression or anxiety (Ellard et al., 2010).
Another way in which a dimensional approach to psychopathology can provide greater treatment flexibility than a categorical approach is in applying a multi-stage approach to assessment. Youngstrom & Van Meter (2016) described a multi-stage approach to assessment in which the treatment provider calculates the posterior probability of disorder based on an instrument score, the extent of risk factors present, and the base rate of the disorder. Based on the posterior probability of disorder, the treatment provider places the client into one of three graded strata: the Green zone, Yellow zone, or Red zone (see Figure 12.3).
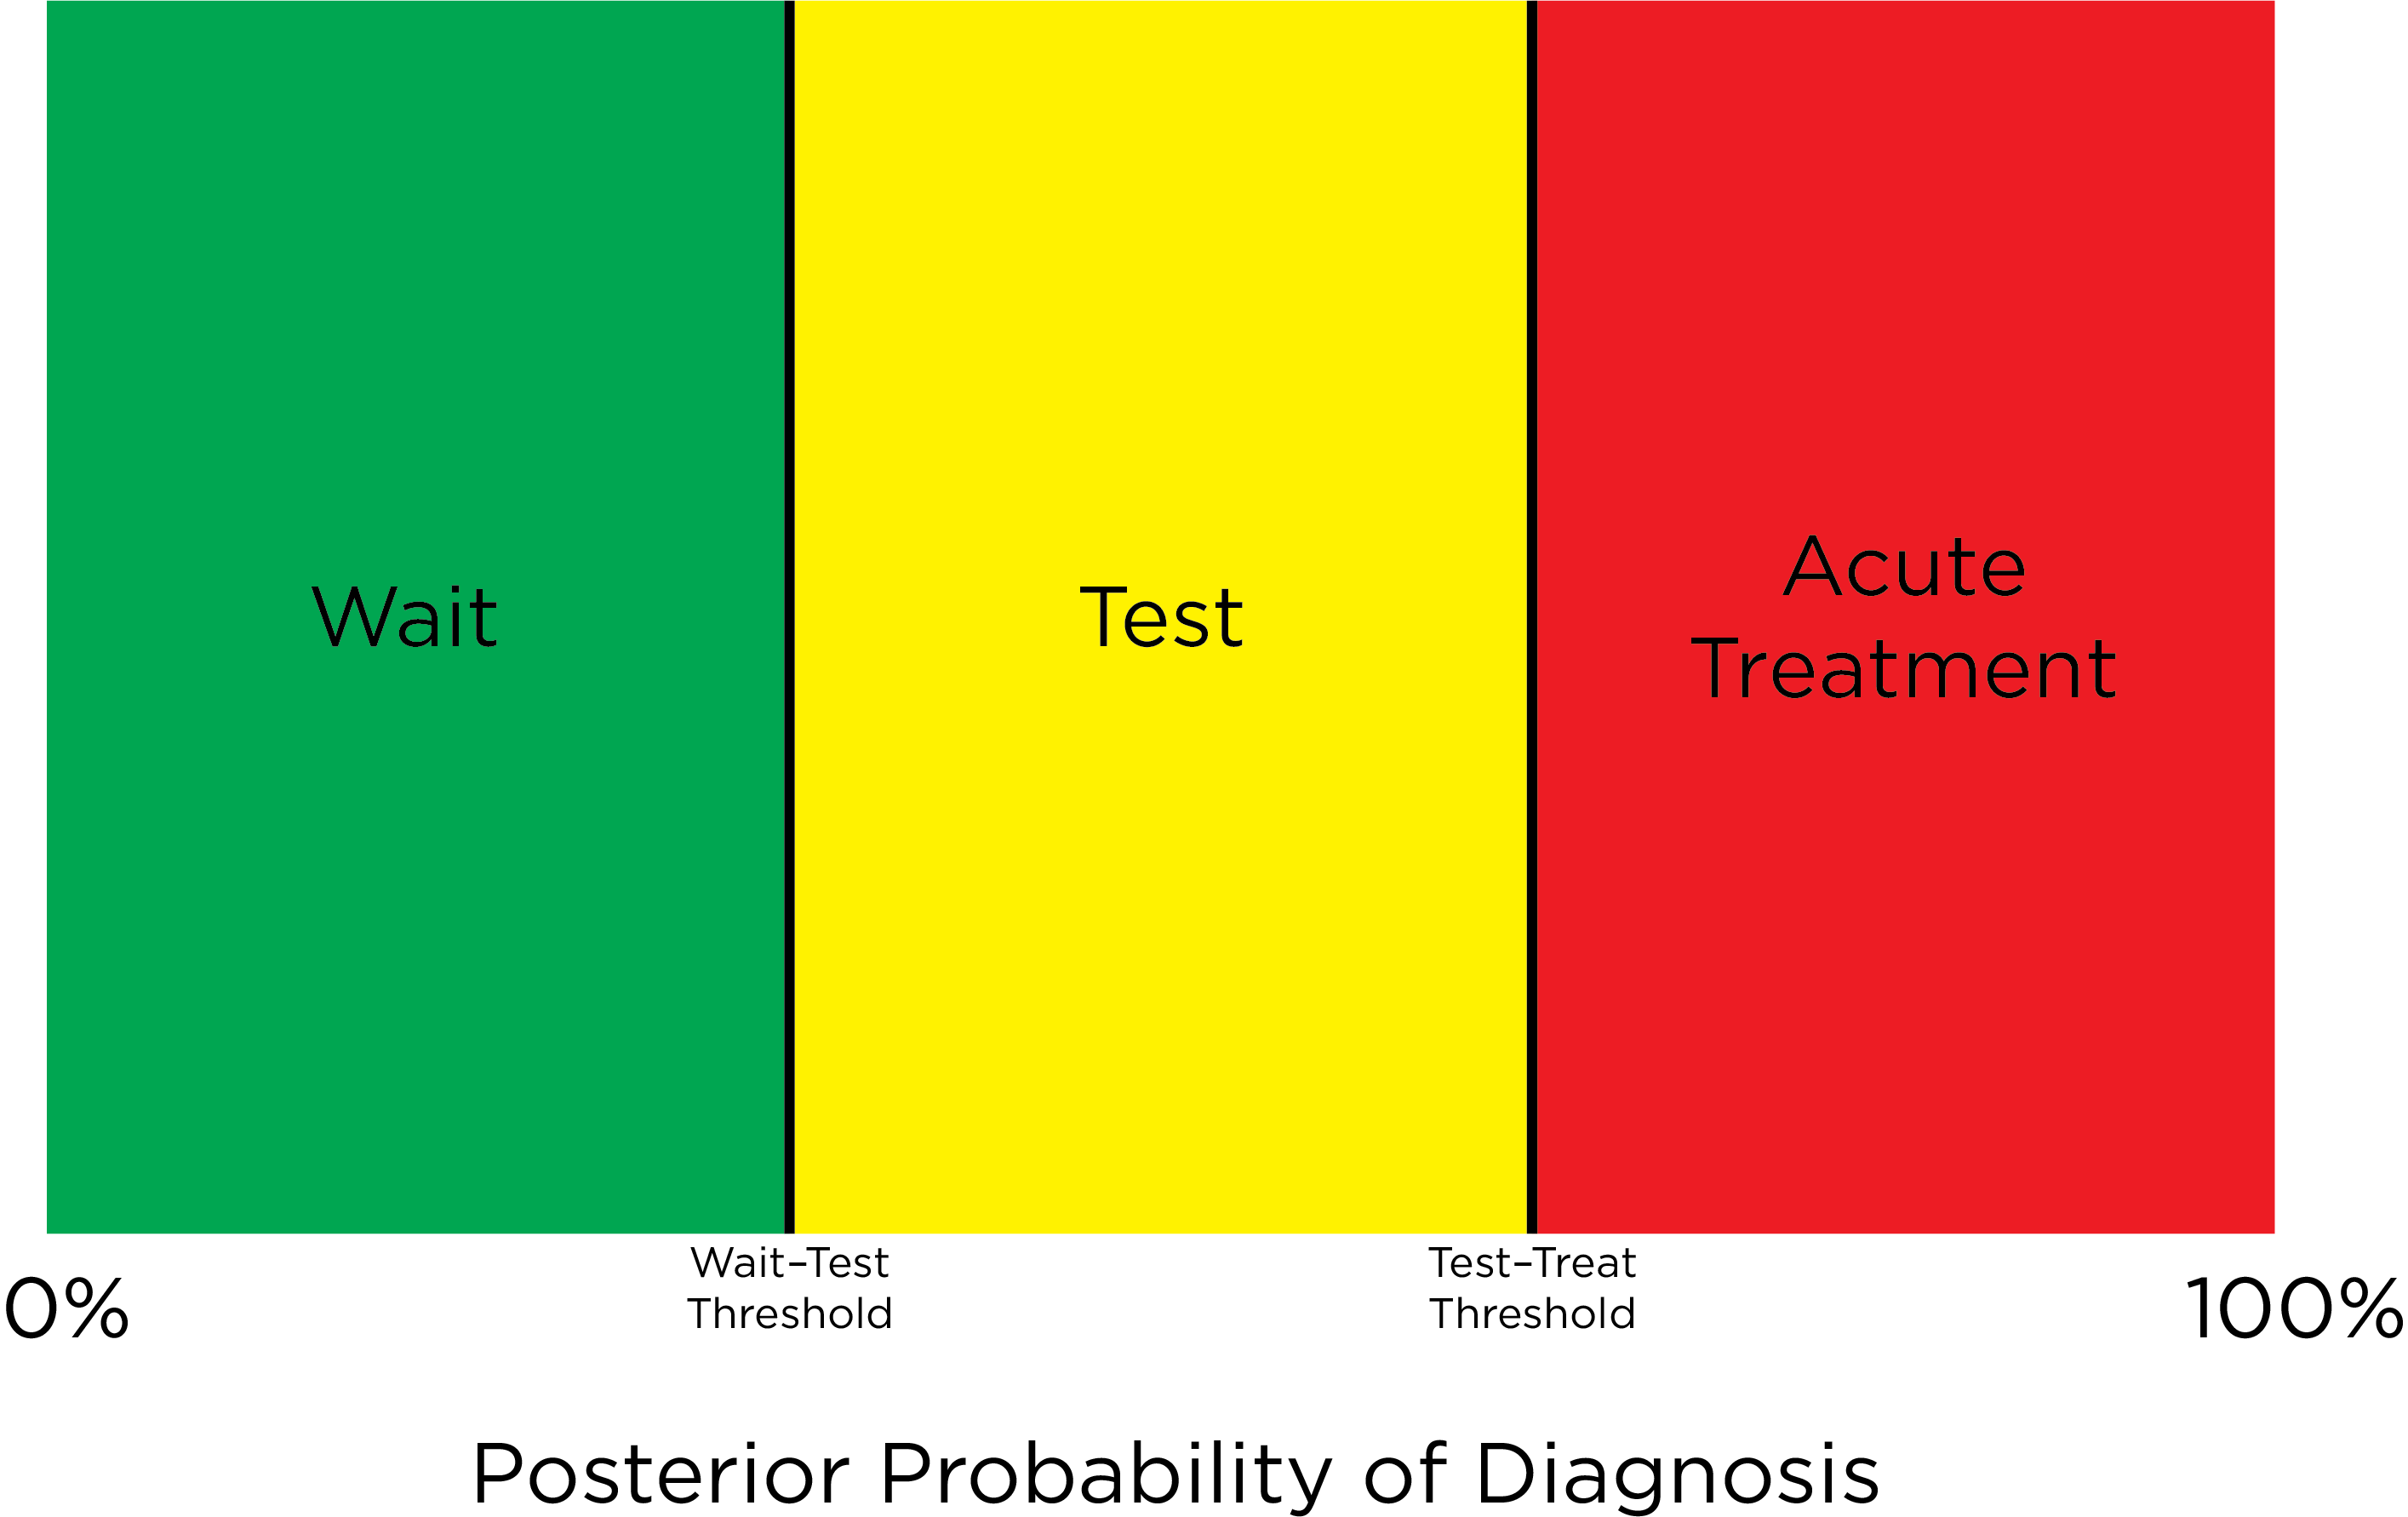
The Green zone is the “Low Probability/Wait Zone”. If the client is in the Green zone, the course of action would be to either do nothing or to engage the client in primary prevention techniques that are safe and inexpensive. The threshold between the Green zone and Yellow zone is the “wait–test” threshold. If the client exceeds the wait–test threshold, they move to the Yellow zone.
The Yellow zone is the “Moderate Probability/Assessment Zone”. If the client is in the Yellow zone, secondary intervention would be indicated, including targeted intervention efforts, or nonspecific and low-risk treatment, such as skills-oriented psychotherapies. More assessment would be indicated until the posterior probability rises into the treatment zone (Red zone) or falls into the wait zone (Green zone). The threshold between the Yellow zone and Red zone is the “test–treat” threshold. If the client exceeds the test–treat threshold, they move to the Red zone.
The Red zone is the “High Probability/Acute Treatment Zone”. If the client is in the Red zone, tertiary intervention would be indicated. The locations of the wait–test threshold and the test–treat threshold depend on the risks and benefits and the client’s preferences.
To conduct a multi-stage approach to assessment, Youngstrom & Van Meter (2016) recommend starting with an instrument with high sensitivity, such as tests with broad content coverage. Low scores on a measure with high sensitivity rule out diagnosis (i.e., the client is in the Green zone), but high scores are ambiguous (i.e., the client is in the Yellow zone) because the measure does not have high specificity. Tests in psychology do not have high accuracy, so cutoffs will commonly be set to prioritize either sensitivity or specificity, depending on the purposes of the assessment (and the relative costs of false negatives versus false positives). The mnemonic device that can be helpful for remembering the utility of sensitivity and specificity is “SNout” and “SPin”. Low (i.e., negative) scores on a test with high sensitivity rule OUT a diagnosis, whereas high (i.e., positive) scores on a test with high specificity rule IN a diagnosis. If a person scores high on the test with high sensitivity and goes to the Yellow zone, follow up with tests that have higher specificity, including more focused tests, to reduce the number of false positives. Ideally, use multiple tests that have incremental validity and do not have high inter-correlation (\(r < .3\)) so that they are not redundant (e.g., not all self-report) and so they meaningfully update the posterior probability. To avoid redundancy with rating scales, you can “take the best”—i.e., include only the most valid rating scale from each informant to test each hypothesis to avoid high inter-correlations and multicollinearity.
To integrate the results of multiple assessments, use a probability nomogram or a diagnostic test calculator (http://araw.mede.uic.edu/cgi-bin/testcalc.pl; archived at https://perma.cc/X8TF-7YBX) to update the posterior probability after each assessment. The locations of the wait–test threshold and test–treat threshold are based on the risks and benefits of diagnosis and treatment, and can also be influenced by the client’s preference for various approaches.
When publishing papers, it is important to report effect sizes, including the AUC, diagnostic likelihood ratios, and correlations between test scores and the criterion. Do not just rely on statistical significance. The effect size is important for determining the practical or clinical significance of the effects. Guidelines for reporting about and evaluating assessments in research reports are provided by Kazdin (1995).
It is also important to report aspects of reliability and validity, both in the current sample and from prior studies. Describe the current sample in adequate detail to understand the population to whom the findings from the study may best generalize. Describe how many items were included in the assessment, the item content (or a description of the content, if proprietary), how the assessment was scored, how scores were aggregated (e.g., sum or mean), the range of possible values, the mean and standard deviation of scores, and what higher values represent.
Assessment in psychology is similar to the Wild West. There are many different measures available. Many measures in psychology do not have evidence of strong psychometrics (reliability/validity) and are not based on research in basic psychological science including cognitive psychology, social psychology, etc. Measures in clinical psychology often focus on complex syndromes and conditions rather than basic states or processes, unlike most tests in medicine.
Because there are so many measures, it can be challenging to know which ones to use. To learn about good tests or the strengths and weaknesses of assessment devices in psychology, there are resources that provide reviews of measures, including the Buros Mental Measurements Yearbook (Buros Center for Testing, 2021), which is published by the Buros Center for Testing, and the Handbook of Psychiatric Measures (Rush et al., 2009), which is published by the American Psychiatric Association. Another valuable resource for learning about available assessments is COSMIN (COnsensus-based Standards for the selection of health Measurement INstruments): https://www.cosmin.nl.
Evidence-based assessment involves using assessment devices that are clinically relevant, culturally sensitive, and scientifically sound. Standards are available for excellent tests. Bayesian updating is a key technique for evidence-based assessment. For assessing psychopathology, evidence-based techniques include dimensional and multi-stage assessment approaches. There are many measures available for assessment; the Buros Mental Measurements Yearbook (Buros Center for Testing, 2021) and the Handbook of Psychiatric Measures (Rush et al., 2009) provide reviews of measures.
R version 4.6.1 (2026-06-24)
Platform: x86_64-pc-linux-gnu
Running under: Ubuntu 24.04.4 LTS

Matrix products: default
BLAS:   /usr/lib/x86_64-linux-gnu/openblas-pthread/libblas.so.3
LAPACK: /usr/lib/x86_64-linux-gnu/openblas-pthread/libopenblasp-r0.3.26.so;  LAPACK version 3.12.0

locale:
 [1] LC_CTYPE=C.UTF-8       LC_NUMERIC=C           LC_TIME=C.UTF-8
 [4] LC_COLLATE=C.UTF-8     LC_MONETARY=C.UTF-8    LC_MESSAGES=C.UTF-8
 [7] LC_PAPER=C.UTF-8       LC_NAME=C              LC_ADDRESS=C
[10] LC_TELEPHONE=C         LC_MEASUREMENT=C.UTF-8 LC_IDENTIFICATION=C

time zone: UTC
tzcode source: system (glibc)

attached base packages:
[1] stats     graphics  grDevices utils     datasets  methods   base

other attached packages:
[1] petersenlab_1.2.3

loaded via a namespace (and not attached):
 [1] gtable_0.3.6       xfun_0.60          ggplot2_4.0.3      htmlwidgets_1.6.4
 [5] psych_2.6.5        lattice_0.22-9     quadprog_1.5-8     vctrs_0.7.3
 [9] tools_4.6.1        Rdpack_2.6.6       generics_0.1.4     parallel_4.6.1
[13] stats4_4.6.1       tibble_3.3.1       cluster_2.1.8.2    pkgconfig_2.0.3
[17] Matrix_1.7-5       data.table_1.18.4  checkmate_2.3.4    RColorBrewer_1.1-3
[21] S7_0.2.2           lifecycle_1.0.5    compiler_4.6.1     farver_2.1.2
[25] stringr_1.6.0      mnormt_2.1.2       mitools_2.4        htmltools_0.5.9
[29] yaml_2.3.12        htmlTable_2.5.0    Formula_1.2-5      pillar_1.11.1
[33] nloptr_2.2.1       MASS_7.3-65        Hmisc_5.2-6        reformulas_0.4.4
[37] rpart_4.1.27       boot_1.3-32        nlme_3.1-169       lavaan_0.6-21
[41] tidyselect_1.2.1   digest_0.6.39      mvtnorm_1.4-1      stringi_1.8.7
[45] reshape2_1.4.5     purrr_1.2.2        dplyr_1.2.1        splines_4.6.1
[49] fastmap_1.2.0      grid_4.6.1         colorspace_2.1-2   cli_3.6.6
[53] magrittr_2.0.5     base64enc_0.1-6    pbivnorm_0.6.0     foreign_0.8-91
[57] scales_1.4.0       backports_1.5.1    rmarkdown_2.31     otel_0.2.0
[61] nnet_7.3-20        lme4_2.0-1         gridExtra_2.3.1    evaluate_1.0.5
[65] knitr_1.51         rbibutils_2.4.1    mix_1.0-13         viridisLite_0.4.3
[69] rlang_1.3.0        Rcpp_1.1.2         xtable_1.8-8       glue_1.8.1
[73] DBI_1.3.0          rstudioapi_0.19.0  minqa_1.2.8        jsonlite_2.0.0
[77] plyr_1.8.9         R6_2.6.1