I want your feedback to make the book better for you and other readers. If you find typos, errors, or places where the text may be improved, please let me know. The best ways to provide feedback are by GitHub or hypothes.is annotations.
You can leave a comment at the bottom of the page/chapter, or open an issue or submit a pull request on GitHub: https://github.com/isaactpetersen/Fantasy-Football-Analytics-Textbook
Alternatively, you can leave an annotation using hypothes.is.
To add an annotation, select some text and then click the
symbol on the pop-up menu.
To see the annotations of others, click the
symbol in the upper right-hand corner of the page.
23 Data Reduction: Principal Component Analysis
This chapter provides an overview of principal component analysis as a useful technique for data reduction.
23.1 Getting Started
23.1.1 Load Packages
23.1.2 Load Data
We created the player_stats_weekly.RData object in Section 4.4.3.
23.1.3 Prepare Data
23.1.3.1 Merge Data
23.1.3.2 Specify Variables
Code
pcaVars <- c(
  "completions","attempts","passing_yards","passing_tds","passing_interceptions",
  "sacks_suffered","sack_yards_lost","sack_fumbles","sack_fumbles_lost",
  "passing_air_yards","passing_yards_after_catch","passing_first_downs",
  "passing_epa","passing_cpoe","passing_2pt_conversions","pacr","pass_40_yds",
  "pass_inc","pass_comp_pct","fumbles","two_pts",
  "avg_time_to_throw","avg_completed_air_yards","avg_intended_air_yards",
  "avg_air_yards_differential","aggressiveness","max_completed_air_distance",
  "avg_air_yards_to_sticks","passer_rating", #,"completion_percentage"
  "expected_completion_percentage","completion_percentage_above_expectation",
  "avg_air_distance","max_air_distance")
23.1.3.3 Standardize Variables
23.2 Overview of Principal Component Analysis
Principal component analysis (PCA) is used if you want to reduce your data matrix. PCA composites represent the variances of an observed measure in as economical a fashion as possible, with no latent underlying variables. The goal of PCA is to identify a smaller number of components that explain as much variance in a set of variables as possible. It is an atheoretical way to decompose a matrix. PCA involves decomposition of a data matrix into a set of eigenvectors, which are transformations of the old variables.
The eigenvectors attempt to simplify the data in the matrix. PCA takes the data matrix and identifies the weighted sum of all variables that does the best job at explaining variance: these are the principal components, also called eigenvectors. Principal components reflect optimally weighted sums.
PCA decomposes the data matrix into any number of components—as many as the number of variables, which will always account for all variance. After the PCA is performed, you can look at the results and discard the components which likely reflect error variance. Judgments about which components to retain are based on empirical criteria in conjunction with theory to select a parsimonious number of components that account for the majority of variance.
The eigenvalue reflects the amount of variance explained by the component (eigenvector). When using a varimax (orthogonal) rotation, an eigenvalue for a component is calculated as the sum of squared standardized component loadings on that component. When using oblique rotation, however, the items explain more variance than is attributable to their factor loadings because the factors are correlated.
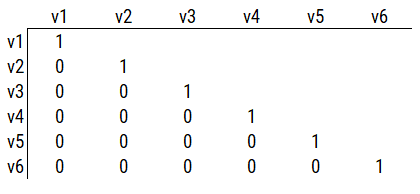
PCA pulls the first principal component out (i.e., the eigenvector that explains the most variance) and makes a new data matrix: i.e., new correlation matrix. Then the PCA pulls out the component that explains the next most variance—i.e., the eigenvector with the next largest eigenvalue, and it does this for all components, equal to the same number of variables. For instance, if there are six variables, it will iteratively extract an additional component up to six components. You can extract as many eigenvectors as there are variables. If you extract all six components, the data matrix left over will be the same as the correlation matrix in Figure 23.1. That is, the remaining variables (as part of the leftover data matrix) will be entirely uncorrelated with each other, because six components explain 100% of the variance from six variables. In other words, you can explain (6) variables with (6) new things!
However, it does no good if you have to use all (6) components because there is no data reduction from the original number of variables. When the goal is data reduction (as in PCA), the hope is that the first few components will explain most of the variance, so we can explain the variability in the data with fewer components than there are variables.
The sum of all eigenvalues is equal to the number of variables in the analysis. PCA does not have the same assumptions as factor analysis, which assumes that measures are partly from common variance and error. But if you estimate (6) eigenvectors and only keep (2), the model is a two-component model and whatever left becomes error. Therefore, PCA does not have the same assumptions as factor analysis, but it often ends up in the same place.
23.3 Decisions in Principal Component Analysis
There are four primary decisions to make in PCA:
- what variables to include in the model and how to scale them
- whether and how to rotate components
- how many components to retain
- how to interpret and use the components
As in factor analysis, the answer you get can differ highly depending on the decisions you make. We provide guidance on each of these decisions below and in Section 22.5.
23.3.1 1. Variables to Include and their Scaling
As in factor analysis, the first decision when conducting a factor analysis is which variables to include and the scaling of those variables. Guidance on which variables to include is in Section 22.5.1.
In addition, before performing a PCA, it is important to ensure that the variables included in the PCA are on the same scale. PCA seeks to identify components that explain variance in the data, so if the variables are not on the same scale, some variables may contribute considerably more variance than others. A common way of ensuring that variables are on the same scale is to standardize them using, for example, z scores.
23.3.2 2. Component Rotation
Similar considerations as in factor analysis can be used to determine whether and how to rotate components in PCA. The considerations for determining whether and how to rotate factors in factor analysis are described in Section 22.5.3.
23.3.3 3. Determining the Number of Components to Retain
Similar criteria as in factor analysis can be used to determine the number of components to retain in PCA. The criteria for determining the number of factors to retain in factor analysis are described in Section 22.5.4.
23.3.4 4. Interpreting and Using PCA Components
The next step is interpreting the PCA components. Use theory to interpret and label the components.
23.4 PCA Versus Factor Analysis
Both factor analysis and PCA can be used for data reduction. The key distinction between factor analysis and PCA is depicted in Figure 23.2.
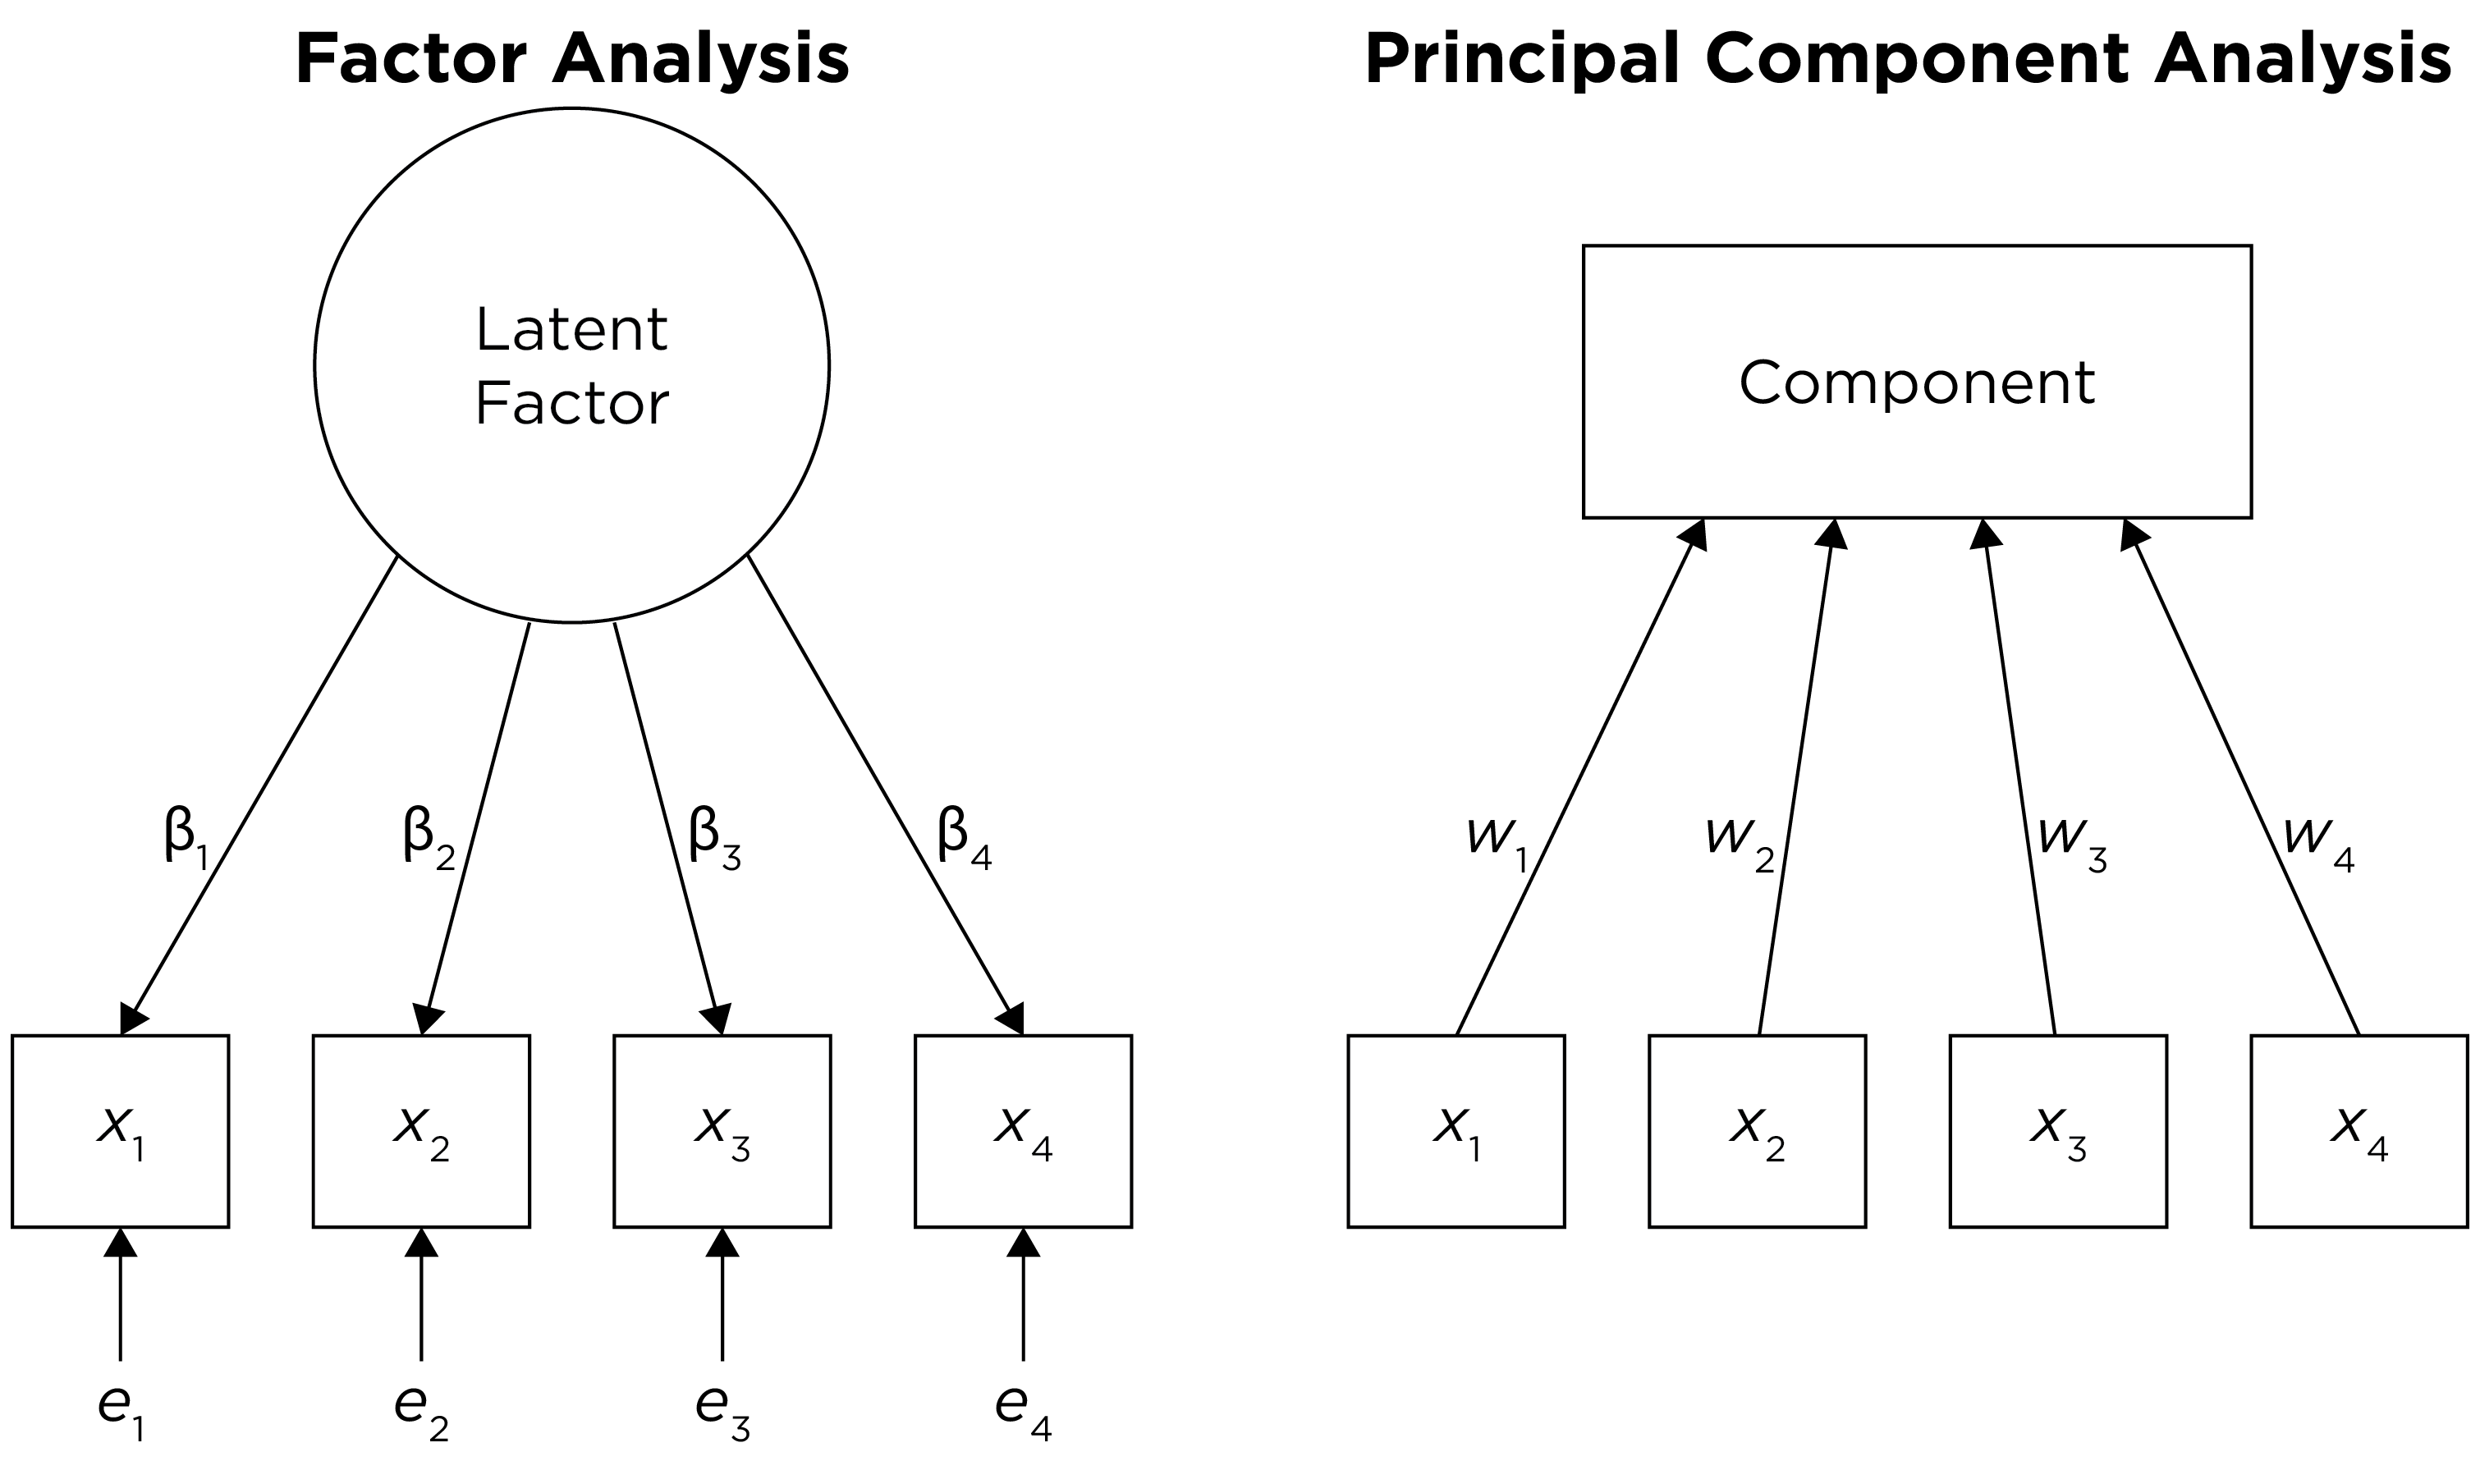
There are several differences between factor analysis and PCA. Factor analysis has greater sophistication than PCA, but greater sophistication often results in greater assumptions. Factor analysis does not always work; the data may not always fit to a factor analysis model. However, PCA can decompose any data matrix; it always works. PCA is okay if you are not interested in the factor structure. PCA uses all variance of variables and assumes variables have no error, so it does not account for measurement error. PCA is good if you just want to form a linear composite and perform data reduction. However, if you are interested in the factor structure, use factor analysis, which estimates a latent variable that accounts for the common variance and discards error variance. Factor analysis better handles error than PCA—factor analysis assumes that what is in the variable is the combination of common construct variance and error. By contrast, PCA uses the total variance (not just the common variance) and assumes that the measures have no measurement error. Factor analysis is useful for the identification of latent constructs—i.e., underlying dimensions or factors that explain (cause) observed scores.
23.5 Example of Principal Component Analysis
We generated the scree plot in Figure 23.3 using the psych::fa.parallel() function of the psych package (Revelle, 2025).
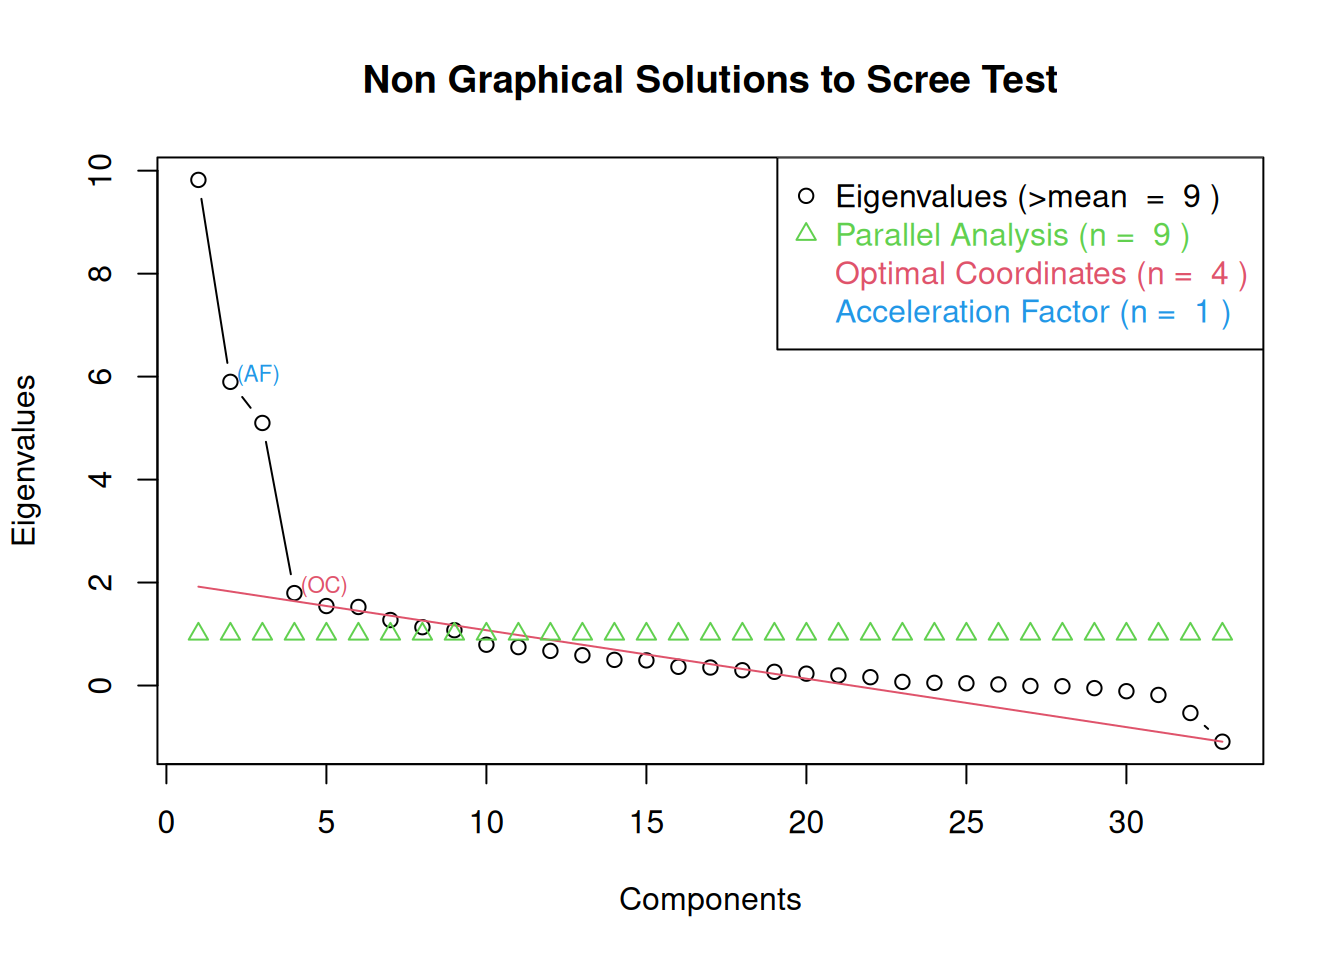
The number of components to keep would depend on which criteria one uses. Based on the rule to keep factors whose eigenvalues are greater than one and based on the parallel test, we would keep nine components. However, based on the Cattell scree test (the “elbow” of the screen plot minus one) (Cattell, 1966), we would keep three components. If using the optimal coordinates, we would keep four components; if using the acceleration factor, we would keep one component. Therefore, interpretability of the components would be important for deciding how many components to keep.
Parallel analysis suggests that the number of factors = NA and the number of components = 9 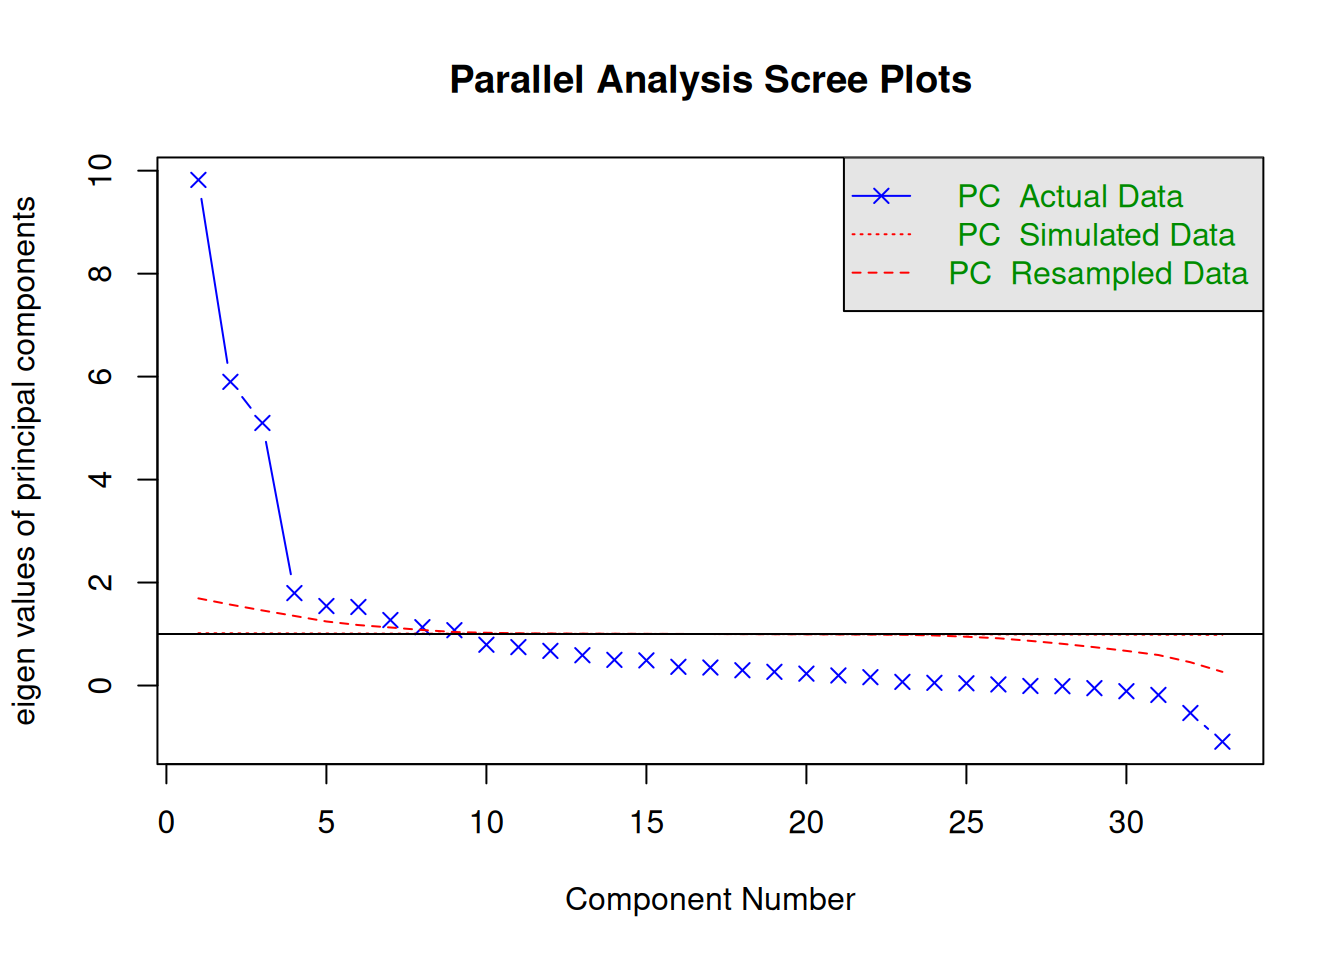
We generated the scree plot in Figure 23.4 using the nFactors::nScree() and nFactors::plotnScree() functions of the nFactors package (Raiche & Magis, 2025).
Code
We generated the very simple structure (VSS) plots in Figures 23.5 and 23.6 using the psych::vss() and psych::nfactors() functions of the psych package (Revelle, 2025). The optimal number of components based on the VSS criterion is three components.
Very Simple Structure
Call: psych::vss(x = dataForPCA[pcaVars], rotate = "oblimin", fm = "pc")
VSS complexity 1 achieves a maximimum of 0.77  with  3  factors
VSS complexity 2 achieves a maximimum of 0.9  with  3  factors

The Velicer MAP achieves a minimum of
Inf with factors
BIC achieves a minimum of Inf with factorsSample Size adjusted BIC achieves a minimum of Inf with factors
Statistics by number of factors
vss1 vss2 map dof chisq prob sqresid fit RMSEA BIC SABIC complex eChisq SRMR
1 0.56 0.00 NaN 0 NA NA 77.2 0.56 NA NA NA NA NA NA
2 0.70 0.75 NaN 0 NA NA 42.9 0.75 NA NA NA NA NA NA
3 0.76 0.89 NaN 0 NA NA 16.4 0.91 NA NA NA NA NA NA
4 0.73 0.89 NaN 0 NA NA 13.2 0.92 NA NA NA NA NA NA
5 0.77 0.90 NaN 0 NA NA 10.8 0.94 NA NA NA NA NA NA
6 0.75 0.90 NaN 0 NA NA 8.5 0.95 NA NA NA NA NA NA
7 0.73 0.89 NaN 0 NA NA 6.9 0.96 NA NA NA NA NA NA
8 0.74 0.88 NaN 0 NA NA 5.6 0.97 NA NA NA NA NA NA
eCRMS eBIC
1 NA NA
2 NA NA
3 NA NA
4 NA NA
5 NA NA
6 NA NA
7 NA NA
8 NA NA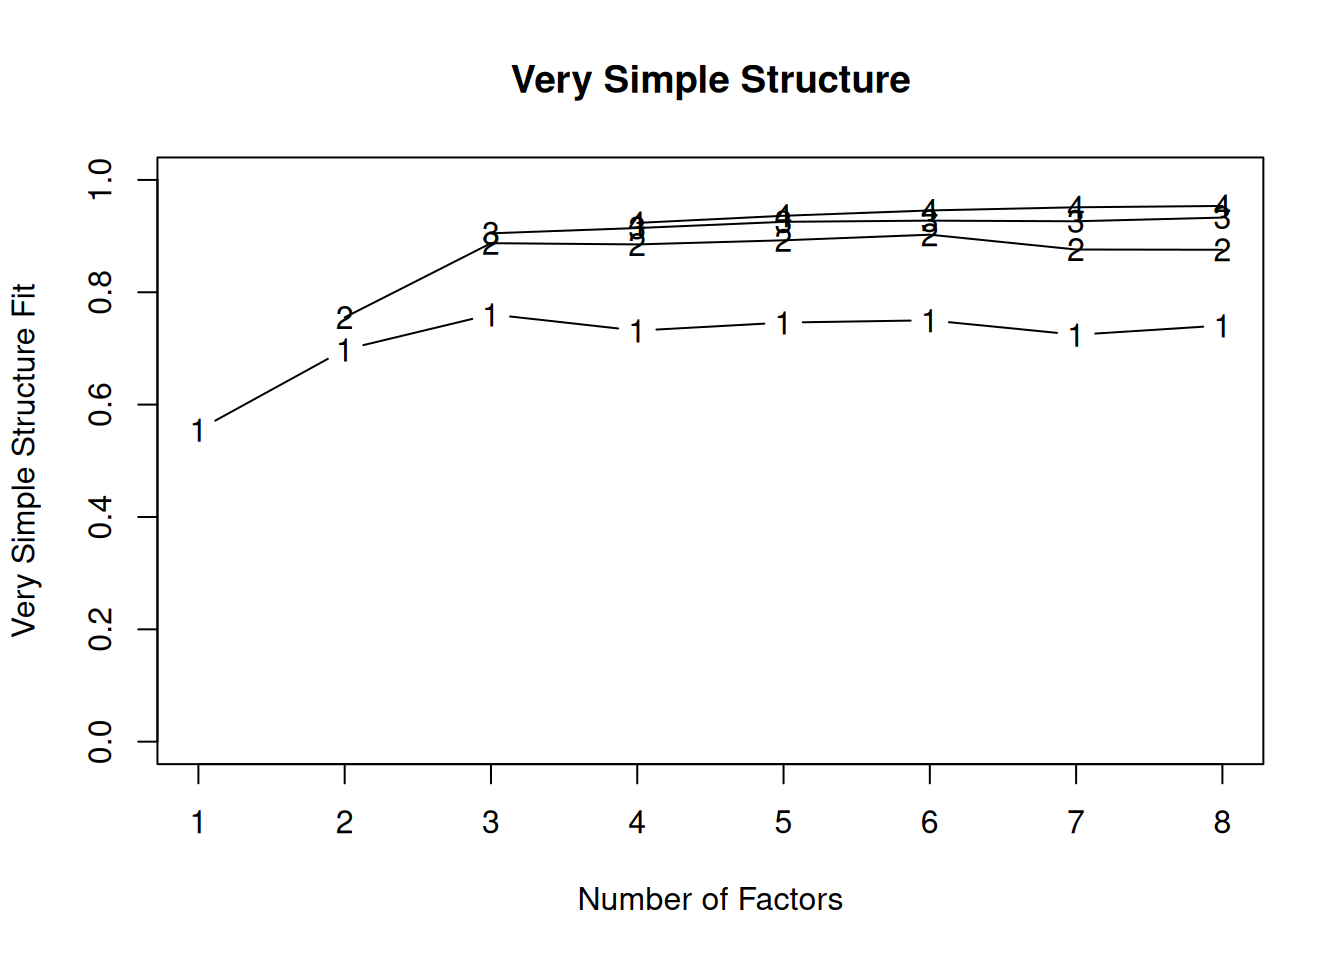
Error in `plot.window()`:
! need finite 'ylim' values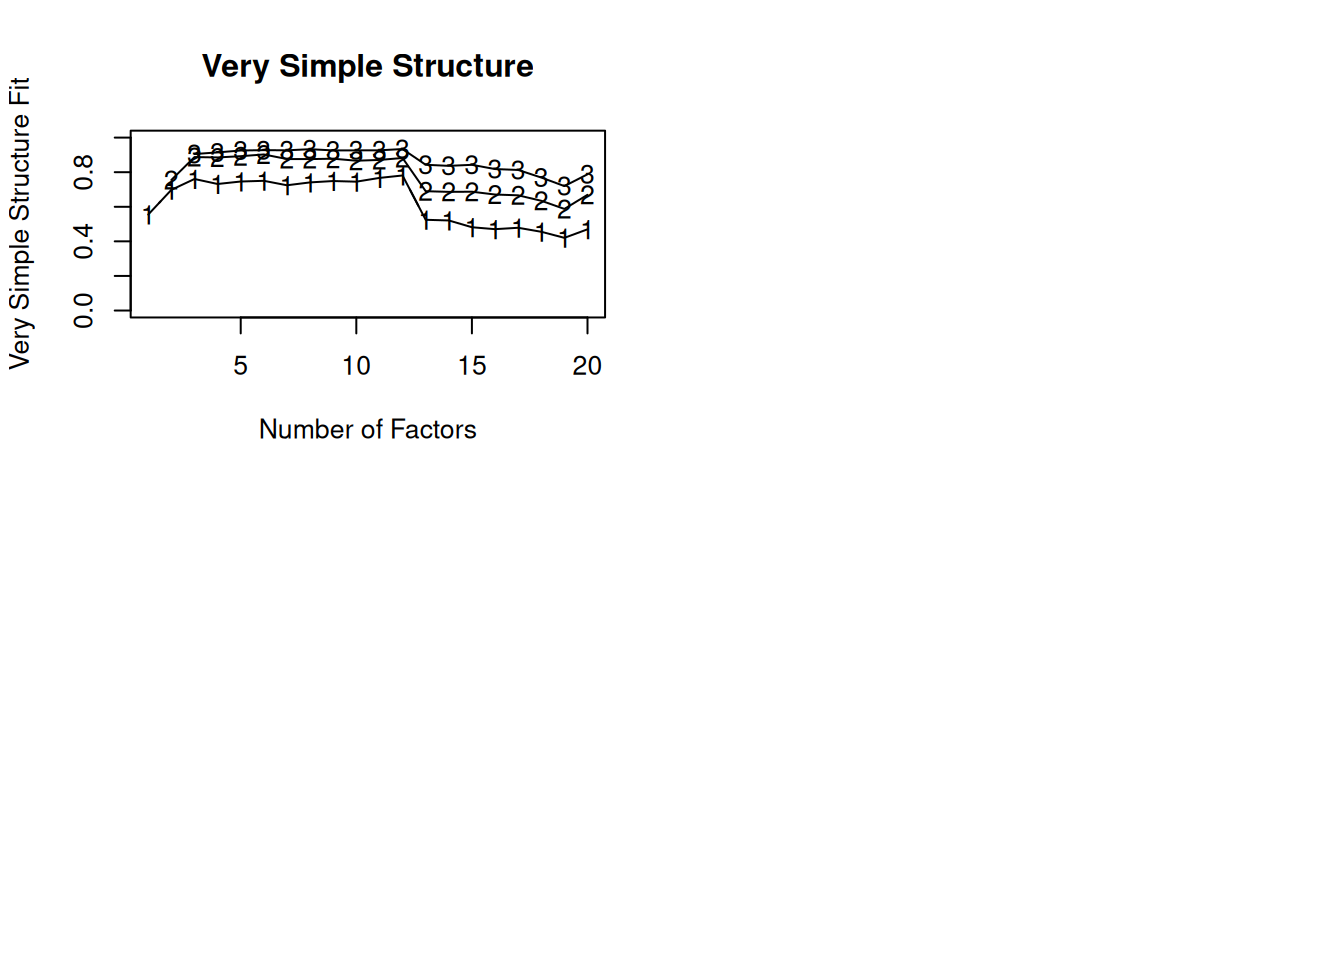
Code
pca1ComponentOblique <- psych::principal(
  dataForPCA[pcaVars],
  nfactors = 1,
  rotate = "oblimin")

pca2ComponentOblique <- psych::principal(
  dataForPCA[pcaVars],
  nfactors = 2,
  rotate = "oblimin")

pca3ComponentOblique <- psych::principal(
  dataForPCA[pcaVars],
  nfactors = 3,
  rotate = "oblimin")

pca4ComponentOblique <- psych::principal(
  dataForPCA[pcaVars],
  nfactors = 4,
  rotate = "oblimin")

pca5ComponentOblique <- psych::principal(
  dataForPCA[pcaVars],
  nfactors = 5,
  rotate = "oblimin")

pca6ComponentOblique <- psych::principal(
  dataForPCA[pcaVars],
  nfactors = 6,
  rotate = "oblimin")

pca7ComponentOblique <- psych::principal(
  dataForPCA[pcaVars],
  nfactors = 7,
  rotate = "oblimin")

pca8ComponentOblique <- psych::principal(
  dataForPCA[pcaVars],
  nfactors = 8,
  rotate = "oblimin")

pca9ComponentOblique <- psych::principal(
  dataForPCA[pcaVars],
  nfactors = 9,
rotate = "oblimin")Principal Components Analysis
Call: psych::principal(r = dataForPCA[pcaVars], nfactors = 1, rotate = "oblimin")
Standardized loadings (pattern matrix) based upon correlation matrix
PC1 h2 u2 com
completions 0.98 9.5e-01 0.0471 1
attempts 0.96 9.3e-01 0.0723 1
passing_yards 1.00 1.0e+00 -0.0078 1
passing_tds 0.83 7.0e-01 0.3044 1
passing_interceptions 0.65 4.2e-01 0.5804 1
sacks_suffered 0.80 6.5e-01 0.3543 1
sack_yards_lost -0.78 6.1e-01 0.3931 1
sack_fumbles 0.57 3.2e-01 0.6774 1
sack_fumbles_lost 0.46 2.1e-01 0.7875 1
passing_air_yards 0.85 7.2e-01 0.2792 1
passing_yards_after_catch 0.89 8.0e-01 0.2001 1
passing_first_downs 0.98 9.7e-01 0.0341 1
passing_epa 0.16 2.4e-02 0.9755 1
passing_cpoe 0.18 3.1e-02 0.9693 1
passing_2pt_conversions 0.26 7.0e-02 0.9300 1
pacr 0.08 6.4e-03 0.9936 1
pass_40_yds 0.31 9.4e-02 0.9062 1
pass_inc 0.89 8.0e-01 0.2004 1
pass_comp_pct 0.23 5.2e-02 0.9476 1
fumbles 0.50 2.5e-01 0.7517 1
two_pts 0.20 4.1e-02 0.9595 1
avg_time_to_throw -0.05 2.6e-03 0.9974 1
avg_completed_air_yards 0.13 1.6e-02 0.9840 1
avg_intended_air_yards -0.19 3.5e-02 0.9648 1
avg_air_yards_differential 0.07 5.2e-03 0.9948 1
aggressiveness -0.01 1.8e-04 0.9998 1
max_completed_air_distance 0.21 4.3e-02 0.9568 1
avg_air_yards_to_sticks 0.08 5.8e-03 0.9942 1
passer_rating 0.16 2.5e-02 0.9750 1
expected_completion_percentage 0.01 8.8e-05 0.9999 1
completion_percentage_above_expectation 0.16 2.7e-02 0.9732 1
avg_air_distance 0.05 2.3e-03 0.9977 1
max_air_distance 0.16 2.6e-02 0.9744 1
PC1
SS loadings 9.83
Proportion Var 0.30
Mean item complexity = 1
Test of the hypothesis that 1 component is sufficient.
The root mean square of the residuals (RMSR) is 0.16
with the empirical chi square 13005259 with prob < 0
Fit based upon off diagonal values = 0.8Principal Components Analysis
Call: psych::principal(r = dataForPCA[pcaVars], nfactors = 2, rotate = "oblimin")
Standardized loadings (pattern matrix) based upon correlation matrix
PC1 PC2 h2 u2 com
completions 0.96 0.22 0.990 0.0096 1.1
attempts 0.96 -0.02 0.930 0.0695 1.0
passing_yards 1.00 0.12 1.016 -0.0159 1.0
passing_tds 0.82 0.17 0.717 0.2829 1.1
passing_interceptions 0.66 -0.22 0.480 0.5203 1.2
sacks_suffered 0.81 -0.09 0.659 0.3409 1.0
sack_yards_lost -0.78 0.09 0.620 0.3803 1.0
sack_fumbles 0.57 -0.07 0.331 0.6690 1.0
sack_fumbles_lost 0.46 -0.07 0.219 0.7810 1.0
passing_air_yards 0.87 -0.41 0.911 0.0887 1.4
passing_yards_after_catch 0.88 0.30 0.872 0.1279 1.2
passing_first_downs 0.97 0.16 0.982 0.0180 1.1
passing_epa 0.13 0.38 0.167 0.8329 1.2
passing_cpoe 0.14 0.54 0.316 0.6837 1.1
passing_2pt_conversions 0.27 -0.03 0.071 0.9288 1.0
pacr 0.04 0.66 0.442 0.5577 1.0
pass_40_yds 0.31 0.00 0.094 0.9060 1.0
pass_inc 0.92 -0.37 0.958 0.0417 1.3
pass_comp_pct 0.19 0.69 0.523 0.4770 1.1
fumbles 0.50 -0.06 0.255 0.7454 1.0
two_pts 0.20 -0.03 0.042 0.9581 1.0
avg_time_to_throw -0.03 -0.36 0.132 0.8682 1.0
avg_completed_air_yards 0.15 -0.37 0.157 0.8428 1.3
avg_intended_air_yards -0.15 -0.70 0.513 0.4866 1.1
avg_air_yards_differential 0.04 0.60 0.368 0.6320 1.0
aggressiveness 0.01 -0.47 0.221 0.7793 1.0
max_completed_air_distance 0.22 -0.13 0.062 0.9382 1.6
avg_air_yards_to_sticks 0.12 -0.72 0.530 0.4701 1.1
passer_rating 0.12 0.63 0.421 0.5790 1.1
expected_completion_percentage -0.03 0.76 0.572 0.4278 1.0
completion_percentage_above_expectation 0.14 0.49 0.262 0.7382 1.2
avg_air_distance 0.09 -0.77 0.593 0.4070 1.0
max_air_distance 0.19 -0.48 0.260 0.7395 1.3
PC1 PC2
SS loadings 9.83 5.86
Proportion Var 0.30 0.18
Cumulative Var 0.30 0.48
Proportion Explained 0.63 0.37
Cumulative Proportion 0.63 1.00
With component correlations of
PC1 PC2
PC1 1.00 0.02
PC2 0.02 1.00
Mean item complexity = 1.1
Test of the hypothesis that 2 components are sufficient.
The root mean square of the residuals (RMSR) is 0.12
with the empirical chi square 7062159 with prob < 0
Fit based upon off diagonal values = 0.89Principal Components Analysis
Call: psych::principal(r = dataForPCA[pcaVars], nfactors = 3, rotate = "oblimin")
Standardized loadings (pattern matrix) based upon correlation matrix
PC1 PC2 PC3 h2 u2 com
completions 0.95 -0.16 0.20 0.992 0.0082 1.1
attempts 0.98 -0.04 -0.04 0.953 0.0468 1.0
passing_yards 0.94 0.10 0.36 1.077 -0.0766 1.3
passing_tds 0.75 0.12 0.45 0.833 0.1669 1.7
passing_interceptions 0.72 -0.02 -0.36 0.609 0.3912 1.5
sacks_suffered 0.86 -0.11 -0.25 0.775 0.2253 1.2
sack_yards_lost -0.84 0.11 0.25 0.736 0.2639 1.2
sack_fumbles 0.62 -0.10 -0.22 0.415 0.5848 1.3
sack_fumbles_lost 0.50 -0.08 -0.19 0.275 0.7246 1.3
passing_air_yards 0.84 0.46 -0.04 0.938 0.0623 1.5
passing_yards_after_catch 0.87 -0.25 0.19 0.880 0.1205 1.3
passing_first_downs 0.93 0.01 0.30 1.005 -0.0045 1.2
passing_epa -0.01 0.17 0.83 0.702 0.2983 1.1
passing_cpoe 0.03 -0.07 0.77 0.611 0.3889 1.0
passing_2pt_conversions 0.27 0.03 0.00 0.071 0.9287 1.0
pacr 0.04 -0.58 0.32 0.454 0.5459 1.6
pass_40_yds 0.22 0.30 0.39 0.302 0.6984 2.5
pass_inc 0.97 0.13 -0.39 1.058 -0.0580 1.4
pass_comp_pct 0.11 -0.31 0.71 0.639 0.3612 1.4
fumbles 0.54 -0.08 -0.18 0.310 0.6897 1.3
two_pts 0.20 0.04 0.01 0.042 0.9580 1.1
avg_time_to_throw -0.05 0.37 -0.11 0.152 0.8480 1.2
avg_completed_air_yards 0.02 0.76 0.37 0.694 0.3058 1.4
avg_intended_air_yards -0.23 0.89 0.01 0.833 0.1671 1.1
avg_air_yards_differential -0.02 -0.31 0.57 0.428 0.5723 1.6
aggressiveness 0.01 0.43 -0.21 0.230 0.7698 1.5
max_completed_air_distance 0.11 0.49 0.42 0.433 0.5666 2.1
avg_air_yards_to_sticks 0.03 0.93 0.03 0.873 0.1274 1.0
passer_rating -0.03 -0.02 0.99 0.969 0.0309 1.0
expected_completion_percentage -0.01 -0.74 0.27 0.627 0.3727 1.3
completion_percentage_above_expectation 0.00 0.04 0.83 0.691 0.3094 1.0
avg_air_distance 0.02 0.91 -0.06 0.843 0.1567 1.0
max_air_distance 0.13 0.61 0.01 0.390 0.6104 1.1
PC1 PC2 PC3
SS loadings 9.73 5.59 5.52
Proportion Var 0.29 0.17 0.17
Cumulative Var 0.29 0.46 0.63
Proportion Explained 0.47 0.27 0.26
Cumulative Proportion 0.47 0.74 1.00
With component correlations of
PC1 PC2 PC3
PC1 1.00 0.03 0.08
PC2 0.03 1.00 -0.03
PC3 0.08 -0.03 1.00
Mean item complexity = 1.3
Test of the hypothesis that 3 components are sufficient.
The root mean square of the residuals (RMSR) is 0.07
with the empirical chi square 2076797 with prob < 0
Fit based upon off diagonal values = 0.97Principal Components Analysis
Call: psych::principal(r = dataForPCA[pcaVars], nfactors = 4, rotate = "oblimin")
Standardized loadings (pattern matrix) based upon correlation matrix
PC1 PC2 PC3 PC4 h2 u2
completions 0.95 -0.17 0.12 0.07 1.00 -0.0028
attempts 0.97 -0.07 -0.13 0.07 0.98 0.0203
passing_yards 0.96 0.09 0.27 0.02 1.08 -0.0824
passing_tds 0.83 0.09 0.32 -0.09 0.85 0.1521
passing_interceptions 0.65 -0.04 -0.37 0.16 0.62 0.3815
sacks_suffered 0.63 -0.06 -0.11 0.46 0.81 0.1922
sack_yards_lost -0.61 0.06 0.11 -0.46 0.77 0.2279
sack_fumbles 0.20 0.03 0.13 0.79 0.73 0.2651
sack_fumbles_lost 0.10 0.05 0.17 0.76 0.60 0.3966
passing_air_yards 0.83 0.44 -0.11 0.08 0.94 0.0564
passing_yards_after_catch 0.91 -0.28 0.08 -0.02 0.91 0.0876
passing_first_downs 0.94 0.00 0.23 0.04 1.01 -0.0104
passing_epa 0.31 0.10 0.55 -0.56 0.79 0.2068
passing_cpoe -0.04 0.00 0.88 0.15 0.73 0.2744
passing_2pt_conversions 0.40 -0.04 -0.16 -0.24 0.15 0.8454
pacr 0.05 -0.57 0.33 0.00 0.45 0.5454
pass_40_yds 0.39 0.25 0.21 -0.29 0.34 0.6597
pass_inc 0.95 0.08 -0.48 0.09 1.11 -0.1057
pass_comp_pct 0.08 -0.26 0.77 0.08 0.69 0.3144
fumbles 0.20 0.03 0.11 0.65 0.52 0.4762
two_pts 0.34 -0.02 -0.15 -0.24 0.12 0.8841
avg_time_to_throw -0.13 0.40 -0.02 0.16 0.18 0.8189
avg_completed_air_yards 0.04 0.78 0.36 -0.01 0.72 0.2825
avg_intended_air_yards -0.25 0.91 0.05 0.03 0.86 0.1384
avg_air_yards_differential 0.00 -0.29 0.57 -0.04 0.44 0.5638
aggressiveness -0.05 0.44 -0.16 0.10 0.24 0.7633
max_completed_air_distance 0.24 0.47 0.30 -0.22 0.44 0.5612
avg_air_yards_to_sticks 0.07 0.92 -0.01 -0.06 0.87 0.1265
passer_rating 0.10 -0.01 0.91 -0.20 0.97 0.0253
expected_completion_percentage 0.06 -0.75 0.21 -0.14 0.64 0.3563
completion_percentage_above_expectation -0.03 0.11 0.91 0.10 0.79 0.2063
avg_air_distance 0.02 0.92 -0.07 0.02 0.85 0.1498
max_air_distance 0.23 0.57 -0.10 -0.16 0.41 0.5945
com
completions 1.1
attempts 1.1
passing_yards 1.2
passing_tds 1.3
passing_interceptions 1.7
sacks_suffered 1.9
sack_yards_lost 2.0
sack_fumbles 1.2
sack_fumbles_lost 1.1
passing_air_yards 1.6
passing_yards_after_catch 1.2
passing_first_downs 1.1
passing_epa 2.6
passing_cpoe 1.1
passing_2pt_conversions 2.0
pacr 1.6
pass_40_yds 3.2
pass_inc 1.5
pass_comp_pct 1.3
fumbles 1.2
two_pts 2.3
avg_time_to_throw 1.6
avg_completed_air_yards 1.4
avg_intended_air_yards 1.2
avg_air_yards_differential 1.5
aggressiveness 1.4
max_completed_air_distance 2.8
avg_air_yards_to_sticks 1.0
passer_rating 1.1
expected_completion_percentage 1.2
completion_percentage_above_expectation 1.1
avg_air_distance 1.0
max_air_distance 1.6
PC1 PC2 PC3 PC4
SS loadings 9.04 5.51 5.00 3.09
Proportion Var 0.27 0.17 0.15 0.09
Cumulative Var 0.27 0.44 0.59 0.69
Proportion Explained 0.40 0.24 0.22 0.14
Cumulative Proportion 0.40 0.64 0.86 1.00
With component correlations of
PC1 PC2 PC3 PC4
PC1 1.00 0.04 0.12 0.30
PC2 0.04 1.00 -0.05 -0.07
PC3 0.12 -0.05 1.00 -0.23
PC4 0.30 -0.07 -0.23 1.00
Mean item complexity = 1.5
Test of the hypothesis that 4 components are sufficient.
The root mean square of the residuals (RMSR) is 0.06
with the empirical chi square 1710178 with prob < 0
Fit based upon off diagonal values = 0.97Principal Components Analysis
Call: psych::principal(r = dataForPCA[pcaVars], nfactors = 5, rotate = "oblimin")
Standardized loadings (pattern matrix) based upon correlation matrix
PC1 PC2 PC3 PC4 PC5 h2
completions 0.94 -0.18 0.12 0.07 0.03 1.01
attempts 0.97 -0.07 -0.13 0.06 0.03 0.99
passing_yards 0.96 0.08 0.27 0.02 0.03 1.09
passing_tds 0.81 0.09 0.33 -0.08 0.07 0.85
passing_interceptions 0.66 -0.04 -0.38 0.15 -0.01 0.63
sacks_suffered 0.63 -0.06 -0.11 0.46 0.02 0.81
sack_yards_lost -0.60 0.06 0.11 -0.47 -0.02 0.77
sack_fumbles 0.19 0.04 0.13 0.81 0.02 0.75
sack_fumbles_lost 0.08 0.06 0.17 0.78 0.02 0.62
passing_air_yards 0.83 0.43 -0.11 0.07 0.03 0.95
passing_yards_after_catch 0.91 -0.28 0.08 -0.02 0.02 0.92
passing_first_downs 0.93 0.00 0.23 0.05 0.06 1.01
passing_epa 0.28 0.09 0.56 -0.54 0.08 0.79
passing_cpoe -0.03 0.01 0.88 0.16 -0.02 0.73
passing_2pt_conversions 0.02 -0.01 -0.03 -0.01 0.90 0.81
pacr 0.04 -0.57 0.34 0.01 0.01 0.46
pass_40_yds 0.43 0.25 0.20 -0.31 -0.07 0.36
pass_inc 0.94 0.08 -0.48 0.08 0.04 1.11
pass_comp_pct 0.08 -0.26 0.77 0.09 -0.02 0.69
fumbles 0.18 0.04 0.11 0.67 0.03 0.54
two_pts -0.06 0.01 -0.01 0.00 0.91 0.81
avg_time_to_throw -0.17 0.41 -0.01 0.18 0.08 0.20
avg_completed_air_yards 0.03 0.78 0.37 0.00 0.04 0.72
avg_intended_air_yards -0.24 0.91 0.04 0.03 -0.02 0.86
avg_air_yards_differential -0.01 -0.29 0.58 -0.02 0.03 0.44
aggressiveness -0.05 0.44 -0.16 0.10 0.01 0.24
max_completed_air_distance 0.28 0.46 0.29 -0.24 -0.08 0.45
avg_air_yards_to_sticks 0.07 0.92 -0.01 -0.06 0.03 0.87
passer_rating 0.08 -0.01 0.92 -0.19 0.02 0.98
expected_completion_percentage 0.08 -0.76 0.21 -0.15 -0.04 0.65
completion_percentage_above_expectation -0.03 0.11 0.91 0.10 -0.03 0.80
avg_air_distance 0.02 0.92 -0.07 0.01 0.00 0.85
max_air_distance 0.28 0.56 -0.12 -0.19 -0.09 0.42
u2 com
completions -0.0078 1.1
attempts 0.0126 1.1
passing_yards -0.0865 1.2
passing_tds 0.1518 1.4
passing_interceptions 0.3734 1.7
sacks_suffered 0.1922 1.9
sack_yards_lost 0.2278 2.0
sack_fumbles 0.2483 1.2
sack_fumbles_lost 0.3754 1.1
passing_air_yards 0.0529 1.6
passing_yards_after_catch 0.0792 1.2
passing_first_downs -0.0117 1.1
passing_epa 0.2068 2.6
passing_cpoe 0.2697 1.1
passing_2pt_conversions 0.1909 1.0
pacr 0.5450 1.6
pass_40_yds 0.6390 3.1
pass_inc -0.1139 1.5
pass_comp_pct 0.3136 1.3
fumbles 0.4618 1.2
two_pts 0.1879 1.0
avg_time_to_throw 0.8028 1.9
avg_completed_air_yards 0.2777 1.4
avg_intended_air_yards 0.1373 1.1
avg_air_yards_differential 0.5604 1.5
aggressiveness 0.7623 1.4
max_completed_air_distance 0.5463 3.1
avg_air_yards_to_sticks 0.1260 1.0
passer_rating 0.0234 1.1
expected_completion_percentage 0.3521 1.3
completion_percentage_above_expectation 0.2031 1.1
avg_air_distance 0.1496 1.0
max_air_distance 0.5753 1.9
PC1 PC2 PC3 PC4 PC5
SS loadings 8.79 5.50 5.02 3.12 1.74
Proportion Var 0.27 0.17 0.15 0.09 0.05
Cumulative Var 0.27 0.43 0.59 0.68 0.73
Proportion Explained 0.36 0.23 0.21 0.13 0.07
Cumulative Proportion 0.36 0.59 0.80 0.93 1.00
With component correlations of
PC1 PC2 PC3 PC4 PC5
PC1 1.00 0.04 0.12 0.30 0.22
PC2 0.04 1.00 -0.05 -0.08 0.02
PC3 0.12 -0.05 1.00 -0.21 0.02
PC4 0.30 -0.08 -0.21 1.00 0.06
PC5 0.22 0.02 0.02 0.06 1.00
Mean item complexity = 1.5
Test of the hypothesis that 5 components are sufficient.
The root mean square of the residuals (RMSR) is 0.06
with the empirical chi square 1522996 with prob < 0
Fit based upon off diagonal values = 0.98Principal Components Analysis
Call: psych::principal(r = dataForPCA[pcaVars], nfactors = 6, rotate = "oblimin")
Standardized loadings (pattern matrix) based upon correlation matrix
PC1 PC2 PC3 PC4 PC6 PC5
completions 0.95 -0.17 0.20 0.04 -0.06 0.03
attempts 0.98 -0.07 -0.05 0.05 -0.09 0.03
passing_yards 0.93 0.07 0.14 0.05 0.26 0.03
passing_tds 0.79 0.08 0.22 -0.06 0.23 0.08
passing_interceptions 0.67 -0.05 -0.30 0.15 -0.13 -0.01
sacks_suffered 0.63 -0.06 -0.04 0.45 -0.11 0.02
sack_yards_lost -0.61 0.06 0.04 -0.45 0.12 -0.01
sack_fumbles 0.17 0.04 0.07 0.82 0.07 0.01
sack_fumbles_lost 0.06 0.06 0.09 0.80 0.10 0.01
passing_air_yards 0.84 0.44 -0.01 0.05 -0.13 0.03
passing_yards_after_catch 0.91 -0.29 0.07 -0.02 0.07 0.02
passing_first_downs 0.92 0.00 0.20 0.05 0.10 0.06
passing_epa 0.26 0.09 0.41 -0.52 0.31 0.09
passing_cpoe -0.02 0.05 0.94 0.09 -0.03 -0.01
passing_2pt_conversions 0.03 0.00 -0.03 -0.02 -0.03 0.90
pacr -0.02 -0.59 0.01 0.10 0.53 0.01
pass_40_yds 0.37 0.21 -0.13 -0.22 0.56 -0.07
pass_inc 0.95 0.07 -0.41 0.09 -0.10 0.04
pass_comp_pct 0.11 -0.21 0.93 -0.01 -0.19 -0.01
fumbles 0.16 0.04 0.04 0.69 0.09 0.02
two_pts -0.04 0.02 -0.02 -0.01 -0.02 0.91
avg_time_to_throw -0.18 0.40 -0.08 0.20 0.08 0.07
avg_completed_air_yards -0.03 0.75 0.05 0.08 0.53 0.03
avg_intended_air_yards -0.24 0.92 0.06 0.02 -0.02 -0.02
avg_air_yards_differential -0.10 -0.33 0.09 0.11 0.79 0.02
aggressiveness -0.04 0.44 -0.09 0.09 -0.13 0.01
max_completed_air_distance 0.23 0.43 0.00 -0.16 0.50 -0.09
avg_air_yards_to_sticks 0.07 0.93 0.02 -0.07 -0.04 0.03
passer_rating 0.05 0.00 0.72 -0.17 0.40 0.03
expected_completion_percentage 0.07 -0.75 0.17 -0.14 0.08 -0.03
completion_percentage_above_expectation -0.02 0.15 0.95 0.04 0.01 -0.02
avg_air_distance 0.03 0.92 -0.02 0.00 -0.08 0.00
max_air_distance 0.29 0.57 -0.01 -0.22 -0.14 -0.08
h2 u2 com
completions 1.03 -0.0312 1.2
attempts 1.00 0.0049 1.0
passing_yards 1.10 -0.0974 1.2
passing_tds 0.85 0.1500 1.4
passing_interceptions 0.63 0.3734 1.6
sacks_suffered 0.81 0.1913 1.9
sack_yards_lost 0.77 0.2267 2.0
sack_fumbles 0.77 0.2275 1.1
sack_fumbles_lost 0.65 0.3498 1.1
passing_air_yards 0.97 0.0339 1.6
passing_yards_after_catch 0.92 0.0788 1.2
passing_first_downs 1.01 -0.0129 1.1
passing_epa 0.79 0.2067 3.3
passing_cpoe 0.84 0.1599 1.0
passing_2pt_conversions 0.81 0.1905 1.0
pacr 0.63 0.3700 2.0
pass_40_yds 0.52 0.4819 2.6
pass_inc 1.11 -0.1149 1.4
pass_comp_pct 0.89 0.1058 1.2
fumbles 0.56 0.4394 1.2
two_pts 0.81 0.1877 1.0
avg_time_to_throw 0.21 0.7891 2.2
avg_completed_air_yards 0.85 0.1451 1.8
avg_intended_air_yards 0.86 0.1358 1.1
avg_air_yards_differential 0.77 0.2259 1.4
aggressiveness 0.24 0.7592 1.4
max_completed_air_distance 0.56 0.4431 2.7
avg_air_yards_to_sticks 0.88 0.1211 1.0
passer_rating 0.98 0.0229 1.7
expected_completion_percentage 0.65 0.3520 1.2
completion_percentage_above_expectation 0.89 0.1056 1.1
avg_air_distance 0.86 0.1445 1.0
max_air_distance 0.45 0.5497 2.0
PC1 PC2 PC3 PC4 PC6 PC5
SS loadings 8.71 5.48 4.10 3.08 2.57 1.74
Proportion Var 0.26 0.17 0.12 0.09 0.08 0.05
Cumulative Var 0.26 0.43 0.55 0.65 0.73 0.78
Proportion Explained 0.34 0.21 0.16 0.12 0.10 0.07
Cumulative Proportion 0.34 0.55 0.71 0.83 0.93 1.00
With component correlations of
PC1 PC2 PC3 PC4 PC6 PC5
PC1 1.00 0.04 0.11 0.31 0.08 0.21
PC2 0.04 1.00 -0.09 -0.08 0.02 0.01
PC3 0.11 -0.09 1.00 -0.16 0.35 0.03
PC4 0.31 -0.08 -0.16 1.00 -0.14 0.07
PC6 0.08 0.02 0.35 -0.14 1.00 0.04
PC5 0.21 0.01 0.03 0.07 0.04 1.00
Mean item complexity = 1.5
Test of the hypothesis that 6 components are sufficient.
The root mean square of the residuals (RMSR) is 0.05
with the empirical chi square 1236752 with prob < 0
Fit based upon off diagonal values = 0.98Principal Components Analysis
Call: psych::principal(r = dataForPCA[pcaVars], nfactors = 7, rotate = "oblimin")
Standardized loadings (pattern matrix) based upon correlation matrix
PC1 PC3 PC2 PC7 PC6 PC4
completions 0.94 0.20 -0.16 -0.04 -0.01 0.04
attempts 0.98 -0.04 -0.06 -0.05 -0.06 0.04
passing_yards 0.90 0.15 0.05 0.27 0.13 0.07
passing_tds 0.77 0.23 0.06 0.24 0.11 -0.05
passing_interceptions 0.71 -0.28 0.08 -0.18 -0.01 0.09
sacks_suffered 0.65 -0.04 0.03 -0.18 0.00 0.41
sack_yards_lost -0.62 0.03 -0.02 0.17 0.01 -0.42
sack_fumbles 0.11 0.05 -0.03 0.03 0.04 0.86
sack_fumbles_lost -0.01 0.06 -0.04 0.08 0.03 0.85
passing_air_yards 0.84 0.02 0.29 0.07 -0.28 0.04
passing_yards_after_catch 0.86 0.06 -0.33 0.11 0.05 0.04
passing_first_downs 0.92 0.21 0.05 0.07 0.09 0.03
passing_epa 0.23 0.41 -0.02 0.40 0.10 -0.47
passing_cpoe -0.03 0.94 -0.01 -0.03 -0.02 0.09
passing_2pt_conversions 0.03 -0.04 -0.01 -0.07 0.00 0.00
pacr 0.02 -0.01 -0.16 0.05 0.75 0.04
pass_40_yds 0.25 -0.15 -0.08 0.74 0.10 -0.07
pass_inc 0.97 -0.39 0.13 -0.08 -0.07 0.05
pass_comp_pct 0.09 0.92 -0.28 -0.14 -0.09 0.02
fumbles 0.10 0.02 -0.02 0.05 0.05 0.72
two_pts -0.05 -0.04 -0.01 -0.06 -0.01 0.01
avg_time_to_throw -0.21 -0.07 0.26 0.17 -0.10 0.23
avg_completed_air_yards -0.03 0.08 0.68 0.53 0.16 0.06
avg_intended_air_yards -0.31 0.07 0.47 0.38 -0.48 0.10
avg_air_yards_differential -0.05 0.09 0.12 0.26 0.88 0.03
aggressiveness 0.12 -0.03 0.76 -0.33 0.05 -0.12
max_completed_air_distance 0.09 -0.02 0.05 0.77 -0.04 -0.01
avg_air_yards_to_sticks 0.04 0.05 0.57 0.32 -0.44 -0.04
passer_rating -0.01 0.70 -0.09 0.39 0.22 -0.10
expected_completion_percentage -0.04 0.11 -0.87 0.11 0.11 0.01
completion_percentage_above_expectation 0.04 0.97 0.25 -0.10 0.09 -0.04
avg_air_distance -0.02 0.01 0.53 0.31 -0.48 0.04
max_air_distance 0.13 -0.03 -0.09 0.47 -0.66 -0.02
PC5 h2 u2 com
completions 0.03 1.03 -0.0313 1.2
attempts 0.03 1.00 0.0032 1.0
passing_yards 0.04 1.10 -0.0981 1.3
passing_tds 0.08 0.85 0.1468 1.5
passing_interceptions -0.03 0.65 0.3544 1.5
sacks_suffered 0.00 0.81 0.1895 1.9
sack_yards_lost 0.00 0.77 0.2258 2.0
sack_fumbles 0.02 0.81 0.1905 1.0
sack_fumbles_lost 0.03 0.70 0.2988 1.0
passing_air_yards 0.03 0.97 0.0286 1.5
passing_yards_after_catch 0.04 0.94 0.0646 1.3
passing_first_downs 0.05 1.02 -0.0244 1.2
passing_epa 0.11 0.79 0.2067 3.7
passing_cpoe -0.01 0.84 0.1595 1.0
passing_2pt_conversions 0.90 0.81 0.1875 1.0
pacr -0.02 0.66 0.3406 1.1
pass_40_yds -0.02 0.58 0.4186 1.4
pass_inc 0.03 1.13 -0.1293 1.4
pass_comp_pct -0.01 0.90 0.1008 1.3
fumbles 0.03 0.59 0.4127 1.1
two_pts 0.92 0.82 0.1826 1.0
avg_time_to_throw 0.08 0.21 0.7864 4.5
avg_completed_air_yards 0.04 0.89 0.1140 2.1
avg_intended_air_yards 0.01 0.88 0.1177 3.8
avg_air_yards_differential 0.00 0.85 0.1502 1.2
aggressiveness -0.04 0.55 0.4475 1.5
max_completed_air_distance -0.04 0.63 0.3684 1.0
avg_air_yards_to_sticks 0.05 0.88 0.1210 2.6
passer_rating 0.05 0.98 0.0193 1.9
expected_completion_percentage 0.00 0.83 0.1671 1.1
completion_percentage_above_expectation -0.03 0.96 0.0403 1.2
avg_air_distance 0.02 0.86 0.1423 2.6
max_air_distance -0.02 0.65 0.3509 2.0
PC1 PC3 PC2 PC7 PC6 PC4 PC5
SS loadings 8.51 4.04 3.51 3.12 3.01 3.00 1.75
Proportion Var 0.26 0.12 0.11 0.09 0.09 0.09 0.05
Cumulative Var 0.26 0.38 0.49 0.58 0.67 0.76 0.82
Proportion Explained 0.32 0.15 0.13 0.12 0.11 0.11 0.07
Cumulative Proportion 0.32 0.47 0.60 0.71 0.82 0.93 1.00
With component correlations of
PC1 PC3 PC2 PC7 PC6 PC4 PC5
PC1 1.00 0.09 -0.01 0.10 0.02 0.37 0.21
PC3 0.09 1.00 -0.09 0.28 0.26 -0.12 0.06
PC2 -0.01 -0.09 1.00 0.23 -0.32 0.01 0.03
PC7 0.10 0.28 0.23 1.00 -0.03 -0.11 0.09
PC6 0.02 0.26 -0.32 -0.03 1.00 -0.05 0.00
PC4 0.37 -0.12 0.01 -0.11 -0.05 1.00 0.06
PC5 0.21 0.06 0.03 0.09 0.00 0.06 1.00
Mean item complexity = 1.7
Test of the hypothesis that 7 components are sufficient.
The root mean square of the residuals (RMSR) is 0.05
with the empirical chi square 1085638 with prob < 0
Fit based upon off diagonal values = 0.98Principal Components Analysis
Call: psych::principal(r = dataForPCA[pcaVars], nfactors = 8, rotate = "oblimin")
Standardized loadings (pattern matrix) based upon correlation matrix
PC1 PC3 PC2 PC7 PC4 PC6
completions 0.92 0.17 -0.09 -0.13 0.08 -0.03
attempts 0.97 -0.02 -0.05 -0.04 0.05 -0.05
passing_yards 0.87 0.12 0.23 0.02 0.11 0.15
passing_tds 0.72 0.09 0.08 0.08 0.09 0.07
passing_interceptions 0.76 -0.05 0.04 0.02 -0.08 0.08
sacks_suffered 0.65 0.05 -0.07 0.02 0.34 0.02
sack_yards_lost -0.63 -0.06 0.07 -0.01 -0.34 -0.01
sack_fumbles 0.07 -0.03 -0.02 -0.01 0.89 -0.01
sack_fumbles_lost -0.05 -0.02 0.02 -0.02 0.88 -0.02
passing_air_yards 0.84 0.09 0.21 0.24 0.00 -0.22
passing_yards_after_catch 0.82 -0.01 -0.04 -0.29 0.12 0.02
passing_first_downs 0.89 0.16 0.00 0.06 0.09 0.07
passing_epa 0.15 0.12 0.08 0.04 -0.21 0.01
passing_cpoe -0.02 0.98 0.10 -0.05 -0.01 0.05
passing_2pt_conversions 0.02 -0.02 -0.05 -0.02 -0.02 0.01
pacr 0.05 0.11 0.06 -0.19 -0.07 0.80
pass_40_yds 0.22 -0.20 0.63 -0.15 -0.01 0.16
pass_inc 0.98 -0.31 -0.01 0.12 0.03 -0.05
pass_comp_pct 0.09 0.89 -0.13 -0.26 -0.01 -0.08
fumbles 0.07 -0.05 -0.01 0.00 0.76 0.01
two_pts -0.05 -0.01 -0.03 -0.03 -0.01 0.01
avg_time_to_throw -0.18 0.06 0.37 0.16 0.09 0.00
avg_completed_air_yards -0.04 0.08 0.61 0.56 0.05 0.23
avg_intended_air_yards -0.31 0.04 0.49 0.38 0.10 -0.42
avg_air_yards_differential -0.06 0.07 0.16 0.09 0.03 0.89
aggressiveness 0.11 -0.10 -0.31 0.80 -0.04 -0.03
max_completed_air_distance 0.10 0.04 0.83 -0.09 -0.06 0.10
avg_air_yards_to_sticks 0.03 0.03 0.43 0.49 -0.03 -0.39
passer_rating -0.07 0.46 0.14 -0.06 0.07 0.16
expected_completion_percentage -0.05 0.09 -0.04 -0.83 0.02 0.11
completion_percentage_above_expectation 0.02 0.91 -0.06 0.25 -0.04 0.09
avg_air_distance -0.01 0.03 0.47 0.43 0.01 -0.41
max_air_distance 0.15 0.02 0.59 -0.18 -0.07 -0.54
PC8 PC5 h2 u2 com
completions 0.11 0.03 1.03 -0.0322 1.2
attempts 0.00 0.03 1.00 0.0032 1.0
passing_yards 0.17 0.04 1.10 -0.0983 1.4
passing_tds 0.44 0.06 0.90 0.1002 1.8
passing_interceptions -0.52 0.02 0.78 0.2190 1.8
sacks_suffered -0.29 0.02 0.82 0.1772 2.0
sack_yards_lost 0.29 -0.02 0.79 0.2135 2.1
sack_fumbles -0.02 -0.01 0.85 0.1457 1.0
sack_fumbles_lost -0.01 0.00 0.74 0.2558 1.0
passing_air_yards -0.12 0.05 0.99 0.0148 1.5
passing_yards_after_catch 0.24 0.02 0.95 0.0491 1.5
passing_first_downs 0.20 0.05 1.03 -0.0293 1.2
passing_epa 0.86 0.06 0.97 0.0348 1.3
passing_cpoe -0.11 0.01 0.96 0.0442 1.1
passing_2pt_conversions 0.01 0.90 0.81 0.1855 1.0
pacr -0.20 0.01 0.77 0.2314 1.3
pass_40_yds 0.31 -0.04 0.58 0.4185 2.3
pass_inc -0.16 0.04 1.13 -0.1299 1.3
pass_comp_pct 0.05 0.00 0.92 0.0763 1.3
fumbles 0.00 0.01 0.62 0.3762 1.0
two_pts 0.00 0.92 0.82 0.1793 1.0
avg_time_to_throw -0.33 0.11 0.29 0.7062 3.3
avg_completed_air_yards 0.09 0.04 0.90 0.1038 2.4
avg_intended_air_yards 0.05 0.01 0.88 0.1171 3.8
avg_air_yards_differential 0.14 0.00 0.86 0.1401 1.2
aggressiveness 0.09 -0.05 0.62 0.3809 1.4
max_completed_air_distance 0.04 -0.02 0.70 0.2985 1.1
avg_air_yards_to_sticks 0.08 0.05 0.88 0.1204 3.0
passer_rating 0.66 0.01 1.04 -0.0394 2.1
expected_completion_percentage 0.12 -0.01 0.83 0.1655 1.1
completion_percentage_above_expectation 0.12 -0.03 0.97 0.0278 1.2
avg_air_distance -0.05 0.03 0.86 0.1393 3.0
max_air_distance -0.04 -0.01 0.67 0.3278 2.4
PC1 PC3 PC2 PC7 PC4 PC6 PC8 PC5
SS loadings 8.34 3.40 3.24 3.05 2.88 2.77 2.65 1.76
Proportion Var 0.25 0.10 0.10 0.09 0.09 0.08 0.08 0.05
Cumulative Var 0.25 0.36 0.45 0.55 0.63 0.72 0.80 0.85
Proportion Explained 0.30 0.12 0.12 0.11 0.10 0.10 0.09 0.06
Cumulative Proportion 0.30 0.42 0.53 0.64 0.74 0.84 0.94 1.00
With component correlations of
PC1 PC3 PC2 PC7 PC4 PC6 PC8 PC5
PC1 1.00 0.08 0.09 -0.03 0.41 0.02 0.04 0.21
PC3 0.08 1.00 0.12 -0.10 0.01 0.24 0.38 0.02
PC2 0.09 0.12 1.00 0.31 -0.02 -0.14 0.19 0.06
PC7 -0.03 -0.10 0.31 1.00 -0.01 -0.28 -0.03 0.04
PC4 0.41 0.01 -0.02 -0.01 1.00 0.03 -0.10 0.11
PC6 0.02 0.24 -0.14 -0.28 0.03 1.00 0.19 -0.02
PC8 0.04 0.38 0.19 -0.03 -0.10 0.19 1.00 0.03
PC5 0.21 0.02 0.06 0.04 0.11 -0.02 0.03 1.00
Mean item complexity = 1.7
Test of the hypothesis that 8 components are sufficient.
The root mean square of the residuals (RMSR) is 0.04
with the empirical chi square 917623.2 with prob < 0
Fit based upon off diagonal values = 0.99Principal Components Analysis
Call: psych::principal(r = dataForPCA[pcaVars], nfactors = 9, rotate = "oblimin")
Standardized loadings (pattern matrix) based upon correlation matrix
PC1 PC3 PC4 PC9 PC6 PC8
completions 0.90 0.18 0.08 -0.01 -0.03 0.09
attempts 0.95 -0.01 0.06 0.02 -0.05 -0.01
passing_yards 0.86 0.11 0.11 0.21 0.15 0.19
passing_tds 0.73 0.06 0.06 0.01 0.06 0.50
passing_interceptions 0.78 -0.05 -0.09 0.02 0.09 -0.50
sacks_suffered 0.69 0.04 0.31 -0.15 0.01 -0.24
sack_yards_lost -0.66 -0.04 -0.32 0.14 0.00 0.24
sack_fumbles 0.06 -0.02 0.90 -0.01 -0.01 -0.04
sack_fumbles_lost -0.06 -0.01 0.89 0.04 -0.01 -0.03
passing_air_yards 0.85 0.09 -0.01 0.17 -0.21 -0.09
passing_yards_after_catch 0.81 -0.02 0.12 0.02 0.01 0.24
passing_first_downs 0.90 0.15 0.08 -0.01 0.07 0.23
passing_epa 0.14 0.09 -0.23 0.04 0.00 0.90
passing_cpoe -0.01 0.98 -0.01 0.06 0.05 -0.10
passing_2pt_conversions 0.01 -0.01 -0.01 -0.02 0.01 0.00
pacr 0.03 0.12 -0.05 0.07 0.80 -0.22
pass_40_yds 0.15 -0.19 0.03 0.69 0.19 0.25
pass_inc 0.99 -0.31 0.02 -0.01 -0.05 -0.14
pass_comp_pct 0.07 0.89 0.00 -0.06 -0.09 0.03
fumbles 0.07 -0.04 0.76 0.00 0.01 0.00
two_pts -0.07 0.00 0.00 0.00 0.01 -0.01
avg_time_to_throw 0.00 -0.05 -0.03 -0.15 -0.02 -0.06
avg_completed_air_yards 0.00 0.04 0.02 0.36 0.25 0.18
avg_intended_air_yards -0.29 0.02 0.08 0.33 -0.40 0.11
avg_air_yards_differential -0.06 0.07 0.04 0.09 0.88 0.15
aggressiveness 0.02 -0.02 0.03 -0.06 -0.01 -0.03
max_completed_air_distance 0.01 0.07 0.00 0.91 0.15 -0.06
avg_air_yards_to_sticks 0.06 0.00 -0.05 0.26 -0.37 0.16
passer_rating -0.08 0.43 0.06 0.09 0.16 0.69
expected_completion_percentage -0.06 0.07 0.03 0.03 0.10 0.09
completion_percentage_above_expectation 0.01 0.93 -0.03 -0.03 0.09 0.11
avg_air_distance 0.02 0.01 0.00 0.31 -0.39 0.02
max_air_distance 0.07 0.05 -0.02 0.71 -0.50 -0.14
PC7 PC2 PC5 h2 u2 com
completions -0.07 -0.17 0.04 1.03 -0.0330 1.2
attempts 0.00 -0.12 0.04 1.00 0.0018 1.1
passing_yards 0.00 0.04 0.03 1.10 -0.0983 1.4
passing_tds 0.00 0.10 0.04 0.93 0.0685 1.9
passing_interceptions 0.02 0.06 0.02 0.78 0.2182 1.8
sacks_suffered -0.04 0.12 0.01 0.83 0.1671 1.9
sack_yards_lost 0.05 -0.12 -0.01 0.79 0.2052 1.9
sack_fumbles 0.02 -0.02 0.00 0.86 0.1381 1.0
sack_fumbles_lost 0.01 -0.01 0.01 0.75 0.2451 1.0
passing_air_yards 0.18 0.17 0.05 0.99 0.0148 1.4
passing_yards_after_catch -0.24 -0.18 0.02 0.95 0.0469 1.5
passing_first_downs 0.03 0.02 0.04 1.03 -0.0348 1.2
passing_epa -0.02 0.00 0.04 1.00 0.0018 1.2
passing_cpoe -0.08 0.09 0.01 0.96 0.0421 1.1
passing_2pt_conversions 0.00 -0.01 0.90 0.82 0.1792 1.0
pacr -0.15 -0.10 0.02 0.78 0.2217 1.4
pass_40_yds -0.09 -0.05 -0.02 0.61 0.3854 1.8
pass_inc 0.11 0.02 0.04 1.13 -0.1306 1.3
pass_comp_pct -0.20 -0.16 0.01 0.93 0.0719 1.2
fumbles 0.01 0.00 0.02 0.63 0.3733 1.0
two_pts 0.00 0.00 0.92 0.83 0.1710 1.0
avg_time_to_throw -0.25 0.90 0.01 0.71 0.2900 1.2
avg_completed_air_yards 0.35 0.57 0.01 0.91 0.0921 3.2
avg_intended_air_yards 0.24 0.43 -0.02 0.89 0.1139 4.6
avg_air_yards_differential 0.05 0.06 0.00 0.86 0.1399 1.1
aggressiveness 0.95 -0.26 0.00 0.82 0.1833 1.2
max_completed_air_distance -0.01 0.00 0.01 0.82 0.1759 1.1
avg_air_yards_to_sticks 0.32 0.45 0.02 0.89 0.1098 3.9
passer_rating -0.11 0.03 0.00 1.05 -0.0522 2.0
expected_completion_percentage -0.73 -0.30 -0.01 0.84 0.1616 1.4
completion_percentage_above_expectation 0.26 0.00 -0.02 0.99 0.0116 1.2
avg_air_distance 0.28 0.45 0.01 0.87 0.1349 3.5
max_air_distance -0.07 -0.08 0.02 0.77 0.2347 2.0
PC1 PC3 PC4 PC9 PC6 PC8 PC7 PC2 PC5
SS loadings 8.31 3.36 2.85 2.70 2.65 2.68 2.44 2.41 1.74
Proportion Var 0.25 0.10 0.09 0.08 0.08 0.08 0.07 0.07 0.05
Cumulative Var 0.25 0.35 0.44 0.52 0.60 0.68 0.76 0.83 0.88
Proportion Explained 0.29 0.12 0.10 0.09 0.09 0.09 0.08 0.08 0.06
Cumulative Proportion 0.29 0.40 0.50 0.59 0.68 0.77 0.86 0.94 1.00
With component correlations of
PC1 PC3 PC4 PC9 PC6 PC8 PC7 PC2 PC5
PC1 1.00 0.07 0.42 0.13 0.02 0.04 -0.01 -0.02 0.22
PC3 0.07 1.00 0.01 0.14 0.24 0.38 -0.13 -0.05 0.01
PC4 0.42 0.01 1.00 -0.04 0.03 -0.09 -0.03 0.00 0.11
PC9 0.13 0.14 -0.04 1.00 -0.10 0.24 0.23 0.28 0.04
PC6 0.02 0.24 0.03 -0.10 1.00 0.18 -0.25 -0.19 -0.01
PC8 0.04 0.38 -0.09 0.24 0.18 1.00 -0.02 0.03 0.04
PC7 -0.01 -0.13 -0.03 0.23 -0.25 -0.02 1.00 0.31 0.01
PC2 -0.02 -0.05 0.00 0.28 -0.19 0.03 0.31 1.00 0.02
PC5 0.22 0.01 0.11 0.04 -0.01 0.04 0.01 0.02 1.00
Mean item complexity = 1.7
Test of the hypothesis that 9 components are sufficient.
The root mean square of the residuals (RMSR) is 0.04
with the empirical chi square 815637 with prob < 0
Fit based upon off diagonal values = 0.99Based on the component solutions, the three-component solution maps onto our three-factor solution from factor analysis. The three-component solution explains more than half of the variance in the variables. The fourth component in a four-component solution is not particularly interpretable, explains relatively little variance, and seems to be related to sacks: sacks suffered, sack yards lost, sack fumbles, and sack fumbles lost. However, two of the sack-related variables (sacks suffered and sack yards lost) load more strongly onto the first component, suggesting that these sack-related variables are better captured by another component. Moreover, sacks might be considered a scoring methodological component rather than a particular concept of interest. For these resources we prefer the three-component solution and choose to retain three components.
Here are the variables that had a standardized component loading of 0.4 or greater on each component:
Code
component1vars <- c(
  "completions","attempts","passing_yards","passing_tds","passing_interceptions",
  "sacks_suffered","sack_yards_lost","sack_fumbles","sack_fumbles_lost",
  "passing_air_yards","passing_yards_after_catch","passing_first_downs",
  #"passing_epa","passing_cpoe","passing_2pt_conversions","pacr","pass_40_yds",
  "pass_inc","fumbles")#,"two_pts","pass_comp_pct",
  #"avg_time_to_throw","avg_completed_air_yards","avg_intended_air_yards",
  #"avg_air_yards_differential","aggressiveness","max_completed_air_distance",
  #"avg_air_yards_to_sticks","passer_rating", #,"completion_percentage"
  #"expected_completion_percentage","completion_percentage_above_expectation",
  #"avg_air_distance","max_air_distance")

component2vars <- c(
  #"completions","attempts","passing_yards","passing_tds","passing_interceptions",
  #"sacks_suffered","sack_yards_lost","sack_fumbles","sack_fumbles_lost",
  "passing_air_yards",#"passing_yards_after_catch","passing_first_downs",
  "pacr",#"passing_epa","passing_cpoe","passing_2pt_conversions","pass_40_yds",
  #"pass_inc","pass_comp_pct","fumbles","two_pts",
  "avg_completed_air_yards","avg_intended_air_yards",#"avg_time_to_throw",
  "aggressiveness","max_completed_air_distance",#"avg_air_yards_differential",
  "avg_air_yards_to_sticks",#"passer_rating", #,"completion_percentage"
  "expected_completion_percentage",#"completion_percentage_above_expectation",
  "avg_air_distance","max_air_distance")

component3vars <- c(
  "passing_tds",#"completions","attempts","passing_yards","passing_interceptions",
  #"sacks_suffered","sack_yards_lost","sack_fumbles","sack_fumbles_lost",
  #"passing_air_yards","passing_yards_after_catch","passing_first_downs",
  "passing_epa","passing_cpoe","pass_40_yds",#"passing_2pt_conversions","pacr",
  "pass_comp_pct",#"fumbles","two_pts","pass_inc",
  "avg_air_yards_differential","max_completed_air_distance",
  "avg_time_to_throw","avg_completed_air_yards","avg_intended_air_yards",
  #"aggressiveness",
  "passer_rating",#"avg_air_yards_to_sticks", #,"completion_percentage"
  "completion_percentage_above_expectation")#,"expected_completion_percentage",
  #"avg_air_distance","max_air_distance")
The variables that loaded most strongly onto component 1 appear to reflect Quarterback usage: completions, incompletions, passing attempts, passing yards, passing touchdowns, interceptions thrown, fumbles, times sacked, sack yards lost (“reversed”—i.e., negatively associated with the component), sack fumbles, sack fumbles lost, passing air yards (total horizontal distance the ball travels on all pass attempts), passing yards after the catch, and first downs gained by passing. Quarterbacks who tend to throw more tend to have higher levels on those variables. Thus, we label component 1 as “Usage”, which reflects total Quarterback involvement, regardless of efficiency or outcome.
The variables that loaded most strongly onto component 2 appear to reflect Quarterback aggressiveness: passing air yards, passing air conversion ratio (reversed; ratio of passing yards to passing air yards), average air yards on completed passes, average air yards on all attempted passes, aggressiveness (percentage of passing attempts thrown into tight windows, where there is a defender within one yard or less of the receiver at the time of the completion or incompletion), expected completion percentage (reversed; based on air distance, receiver separation, Quarterback/Wide Receiver movement, pass location, whether there was pressure on the Quarterback when throwing, the throw angle and trajectory, receiver and defender positioning at the catch point, and defensive coverage scheme), average amount of air yards ahead of or behind the first down marker on passing attempts, average air distance (the true three-dimensional distance the ball travels in the air), maximum air distance, and maximum air distance on completed passes. Quarterbacks who throw the ball farther and into tighter windows tend to have higher values on those variables. Thus, we label component 2 as “Aggressiveness”, which reflects throwing longer, more difficult passes with a tight window.
The variables that loaded most strongly onto component 3 appear to reflect Quarterback performance: passing touchdowns, passing expected points added, passing completion percentage above expectation, passes completed of 40 yards or more, pass completion percentage, air yards differential (intended air yards \(-\) completed air yards; attempting deeper passes than he on average completes), maximum completed air distance, average time to throw, average completed air yards, average intended air yards, and passer rating. Quarterbacks who perform better tend to have higher values on those variables. Thus, we label component 3 as “Performance”.
Below are component scores from the PCA for the first six players:
          PC1        PC2        PC3
[1,] 5.637180  0.1146498 -1.3352948
[2,] 4.016126  1.9541489  0.8332614
[3,] 8.448620 -0.3990346 -2.8675309
[4,] 4.194377  1.0558373  1.7625766
[5,] 5.818510  1.3755224 -0.5800828
[6,] 6.178649 -0.3438007  0.3924102
Here are the players and weeks that showed the highest levels of Quarterback “Usage”:
Code
Here are the players and weeks that showed the lowest levels of Quarterback “Usage”:
Code
Here are the players and weeks that showed the highest levels of Quarterback “Aggressiveness”:
Code
Here are the players and weeks that showed the lowest levels of Quarterback “Aggressiveness”:
Code
Here are the players and weeks that showed the highest levels of Quarterback “Performance”:
Code
Here are the players and weeks that showed the lowest levels of Quarterback “Performance”:
23.6 Conclusion
Principal component analysis (PCA) is a technique used for data reduction—reducing a large set of a variables down to a smaller set of components that capture most of the variance in the larger set. There are many decisions to make in factor analysis. These decisions can have important impacts on the resulting solution. Thus, it can be helpful for theory and interpretability to help guide decision-making when conducting factor analysis. There are several differences between factor analysis and PCA. Unlike factor analysis, which estimates the latent factors as the common variance among the variables that load onto that factor and discards the remaining variance as “error”, PCA uses all variance of variables and assumes variables have no error. Thus, PCA does not account for measurement error. Using PCA, we were able to identify three PCA components that accounted for considerable variance in the variables we examined, pertaining to Quarterbacks: 1) usage; 2) aggressiveness; 3) performance. We were then able to determine which players were highest and lowest on each of these components.
23.7 Session Info
R version 4.6.1 (2026-06-24)
Platform: x86_64-pc-linux-gnu
Running under: Ubuntu 24.04.4 LTS

Matrix products: default
BLAS:   /usr/lib/x86_64-linux-gnu/openblas-pthread/libblas.so.3
LAPACK: /usr/lib/x86_64-linux-gnu/openblas-pthread/libopenblasp-r0.3.26.so;  LAPACK version 3.12.0

locale:
 [1] LC_CTYPE=C.UTF-8       LC_NUMERIC=C           LC_TIME=C.UTF-8
 [4] LC_COLLATE=C.UTF-8     LC_MONETARY=C.UTF-8    LC_MESSAGES=C.UTF-8
 [7] LC_PAPER=C.UTF-8       LC_NAME=C              LC_ADDRESS=C
[10] LC_TELEPHONE=C         LC_MEASUREMENT=C.UTF-8 LC_IDENTIFICATION=C

time zone: UTC
tzcode source: system (glibc)

attached base packages:
[1] stats     graphics  grDevices utils     datasets  methods   base

other attached packages:
 [1] lubridate_1.9.5  forcats_1.0.1    stringr_1.6.0    dplyr_1.2.1
 [5] purrr_1.2.2      readr_2.2.0      tidyr_1.3.2      tibble_3.3.1
 [9] ggplot2_4.0.3    tidyverse_2.0.0  nFactors_2.4.1.2 psych_2.6.5

loaded via a namespace (and not attached):
 [1] gtable_0.3.6         jsonlite_2.0.0       compiler_4.6.1
 [4] tidyselect_1.2.1     parallel_4.6.1       scales_1.4.0
 [7] yaml_2.3.12          fastmap_1.2.0        lattice_0.22-9
[10] R6_2.6.1             generics_0.1.4       knitr_1.51
[13] htmlwidgets_1.6.4    tzdb_0.5.0           pillar_1.11.1
[16] RColorBrewer_1.1-3   rlang_1.3.0          stringi_1.8.7
[19] xfun_0.60            S7_0.2.2             otel_0.2.0
[22] timechange_0.4.0     cli_3.6.6            withr_3.0.3
[25] magrittr_2.0.5       digest_0.6.39        grid_4.6.1
[28] hms_1.1.4            lifecycle_1.0.5      nlme_3.1-169
[31] vctrs_0.7.3          mnormt_2.1.2         evaluate_1.0.5
[34] glue_1.8.1           GPArotation_2026.6-1 farver_2.1.2
[37] rmarkdown_2.31       tools_4.6.1          pkgconfig_2.0.3
[40] htmltools_0.5.9